
After years of trading in the shadow of its southern neighbour in the early part of the 2020s, Canada is having its moment.
In 2025, the S&P/TSX Composite Index surged more than 30%, outpacing the S&P 500 and many of the world’s other major indices. That momentum has carried into 2026, with Canadian markets pushing to new highs even as the country navigates a unique set of economic and geopolitical challenges heading into the fall.
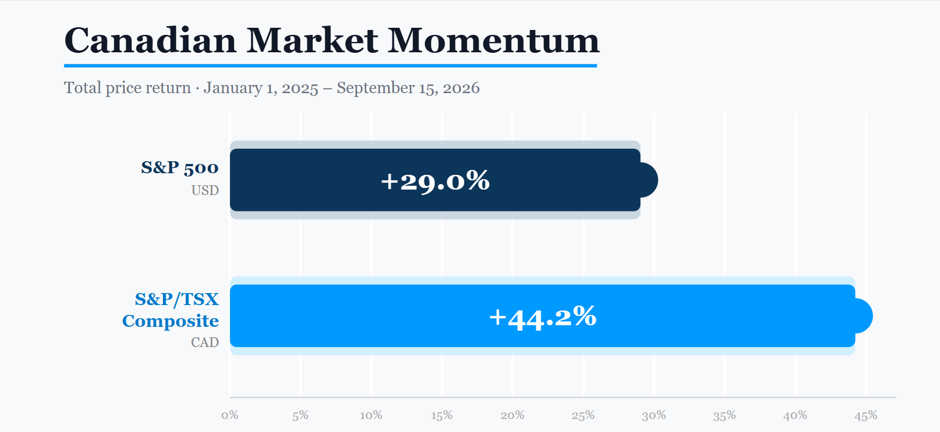
Source: Yahoo Finance (GSPC: 5,881.63 – 7,585.73; GSPTSE: 24,678 – 35,582.07) as at September 15, 2026.
The story behind the numbers is one of breadth. Canada’s public markets are anchored by some of the strongest banks in the developed world, a deep bench of global resource and energy companies, established utilities and telecommunications players, and a growing roster of businesses competing on the world stage in technology and innovation. It’s a mix that gives Canadian equities a diversification few other national markets can match.
Taking stock: Canada’s leaders exceeding expectations
Energy leaders like Canadian Natural Resources and Suncor have benefited from elevated commodity prices and continued global demand for reliable, secure energy supply. The price of Western Canadian Select (WCS) has climbed from approximately $60 a barrel in early 2026 to just under $80 a barrel as of September 15, 2026. Fuel prices in Canada have followed suit, significantly impacted by the Iran War.
Suncor Energy matched its quarterly record in the second quarter of 2026, delivering adjusted funds from operations of $5.3 billion. It set an all-time quarterly per share record of $4.52. Moreover, Suncor posted record Q2 2 refining throughput of 471,000 barrels per day (bbl/d) and record Q2 refined product sales of 655,000 bbl/d.
Canadian Natural Resources also topped estimates in Q2 2026, posting record total production of 1.68 million barrels of oil equivalent per day (boe/d) – up 18% year over year. The company delivered record adjusted net earnings of $4.6 billion and adjusted funds flow of $6.9 billion and returned $4.0 billion to shareholders through dividends.
Meanwhile, Shopify has emerged as one of Canada’s clearest technology success stories. The company has grown into a global e-commerce platform that has been able to compete with the biggest names in U.S. tech. Shopify exceeded expectations in its second quarter 2026, posted revenue growth of 34% year-over-year to $3.58 billion. Meanwhile, gross profit jumped 31% to $1.71 billion.
And, of course, we cannot leave out Canada’s Big Six banks, which turned in fantastic numbers in the third quarter. Two out of six – Royal Bank and TD Bank – are in HHIC. The Harvest Premium Yield Canadian Bank ETF (TSX: HPYB) invests in an equal-weight portfolio of each of the Big Six Canadian banks.
Q3 Earnings: Canada’s Big Six Banks:
Royal Bank | Adjusted net income growth of 10% to $6.1 billion and adjusted diluted earnings per share growth of 11% to $4.28. Profit growth in Wealth Management, Capital Markets, and Commercial Banking segments.
TD Bank | Adjusted earnings and earnings per share grew 21% and 26%, respectively, from the prior year to $4.7 billion and $2.77. Record earnings in Wholesale Banking and growing momentum in U.S. banking.
Bank of Montreal| Adjusted net income growth of 21% to $8.14 billion in the year-to-date period. Record pre-provision pre-tax earnings in every BMO business segment.
Scotiabank | Adjusted net income of $2.97 billion and adjusted EPS of $2.28 – up from $2.51 billion and $1.88 in the prior year. Earnings growth of 12% in Canadian Banking segment, 8% in International Banking, 23% in Global Wealth Management, and 37% in Global Banking and Markets.
CIBC | Revenue growth of 15% year-over-year to $8.36 billion, adjusted net income growth of 26% to $2.64 billion and $2.73 in adjusted EPS. Strong earnings growth in all core business segments.
National Bank | Adjusted net income growth of 20% to $3.98 billion and 17% on an adjusted EPS basis to $3.39. Earnings growth of 14% in Personal and Commercial Banking, 21% in Wealth Management, and 32% in Capital Markets segments.
When we layer in Canada’s major banks a picture emerges of an economy that is not defined by a single sector. On the contrary, Canada has delivered strength across many sectors.
Canada’s business investment rebrand
This is the essential shift in how investors are starting to view Canada. The story is about where the country is heading. A more diversified economy, an expanding role in global resources and energy, and companies increasingly well-positioned to capture the opportunities ahead. From September 14-15 the country hosted the Canada Investment Summit, aiming to attract business and investment opportunities from around the world.
At the Summit, Canadian Prime Minister Mark Carney touted a corporate tax ‘mega deduction’. To encourage domestic business investment, the deduction would bring Canada’s marginal effective tax rate on new business investment from roughly 13% to 6.4%. That would represent the lowest marginal effective tax rate of any major economy in the world, and less than half the rate in the United States.
HHIC turns one year old
That diversified opportunity is exactly what the Harvest Canadian High Income Shares ETF (TSX: HHIC) was built to capture.
Annual Performance
As at 2026/08/31
| Ticker | 1M | 3M | 6M | YTD | 1Y | SI |
|---|---|---|---|---|---|---|
| HHIC | 6.89 | 3.96 | 5.22 | 17.80 | 32.92 | 36.87 |
HHIC was launched in August 2025. The ETF recently marked its first anniversary. Its performance over the first year reflects the broader Canadian growth story; a compelling mix of established industry leaders, natural-resource strength, and some of the world’s most resilient financial institutions. All these equities are held in a single, 100% Canadian portfolio.
This ETF brings together leading Canadian companies that span core sectors; from energy and financials to technology. HHIC offers investors exposure to emerging businesses like Shopify, energy titans like Enbridge and Suncor, and Canada’s major banks like Royal Bank and TD, without having to assemble that exposure stock by stock.
What differentiates HHIC from a simple buy-and-hold basket of Canadian equities is its income strategy. The ETF employs an active covered call strategy, writing options against its holdings to generate premium income. HHIC applies modest leverage of approximately 25% to further enhance both monthly cash distributions and growth potential. The goal is to give investors a way to participate in the upside of Canada’s leading companies while also generating high levels of monthly income along the way.
Investing in Canada’s moment
As Canada moves through a period of real economic momentum, and real uncertainty, the case for owning a diversified slice of the country’s strongest businesses has only grown stronger. Canada’s banks continue to anchor the financial system with consistent profitability. Its resource and energy companies remain central to global supply chains. And, its technology sector continues to prove that Canadian innovation can compete on the global stage.
One year in, HHIC offers a one ticket way to access Canadian breadth. Strength, performance, and designed to generate a high monthly distribution yield, built entirely from Canadian leaders.
Disclaimer
Commissions, management fees and expenses all may be associated with investing in Harvest High Income Shares ETFs managed by Harvest Portfolios Group Inc. (the “Funds” or a “Fund”). Please read the relevant prospectus before investing. The Funds’ returns are not guaranteed, their values change frequently, and past performance may not be repeated. Tax investment and all other decisions should be made with guidance from a qualified professional.
The Fund is categorized as a liquid alternative ETF. This means it can use leverage and can invest more than 10% of its assets in a single issuer. The Fund employs modest leverage of approximately 25%, which can amplify both gains and losses. Distributions are paid to you in cash unless you request, pursuant to your participation in a distribution reinvestment plan, that they be reinvested into available ETF Class A Units of the Fund. If a Fund earns less than the amounts distributed, the difference is a return of capital.
The indicated rates of return are the historical annual compounded total returns (except for figures of one year or less, which are simple total returns) including changes in unit value and reinvestment of all distributions and do not take into account sales, redemption, distribution or optional charges or income taxes payable by any securityholder that would have reduced returns.
Certain statements included in this communication constitute forward-looking statements (“FLS”, including, but not limited to, those identified by the expressions “expect”, “intend”, “will” and similar expressions to the extent they relate to the Funds. The FLS are not historical facts but reflect the Harvest’s and the portfolio manager of the Funds current expectations regarding future results or events. These FLS are subject to a number of risks and uncertainties that could cause actual results or events to differ materially from current expectations. Although Harvest and the portfolio manager of the Funds believe that the assumptions inherent in the FLS are reasonable, FLS are not guarantees of future performance and, accordingly, readers are cautioned not to place undue reliance on such statements due to the inherent uncertainty therein. The Funds, Harvest and the portfolio manager of the Funds undertake no obligation to update publicly or otherwise revise any FLS or information whether as a result of new information, future events or other such factors which affect this information, except as required by law.
All rights to the trademarks and/or logos listed herein belong to their respective owners and Harvest ETFs use hereof does not imply any affiliation with, or endorsement by the owners of these trademarks and/or logos.