By Ambrose O’Callaghan
The 2026 United States midterm elections are drawing significant attention from markets and investors as the fall season approaches. Midterm elections, which will determine control of the Senate and House between Republicans and Democrats, are scheduled to be held, on November 3, 2026.
Current polling and betting markets suggest Democrats are favoured to win a House majority, while the Senate race is considered closely contested. A shift in congressional control would have implications for policy direction and for either party’s ability to advance its legislative priorities, including trade policy.
Some analysts suggest that a change in congressional majorities could affect the pace or scope of the current administration’s policy agenda. However, historical precedent shows that market and policy outcomes don’t always follow expected patterns after elections, so investors should be cautious about assuming any particular result.
So, where might markets be headed as this election approaches? In this piece, we’ll examine how markets have responded to past election cycles and what lessons investors might draw from that history. Let’s dive in.
How the market has behaved during and following elections | A retrospective
When we look at the performance data following previous presidential election cycles, the clearest pattern that emerges is that election-year volatility tends to resolve into strong post-election gains. The chart below shows the S&P 500 posting positive returns in 8 out of 9 election cycles, and typically quite large ones. Indeed, 1996, 2008, 2012, and 2020 all show 15%+ gains the following year. The 2000 election is the notable exception as it followed the dot-com peak.
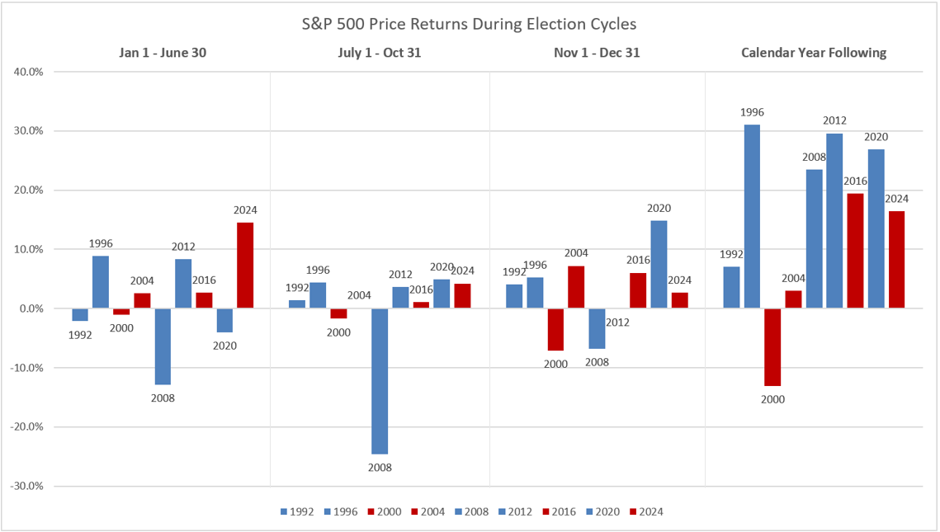
Red bars: Republican | Blue bars: Democratic
Source: Bloomberg, July 17, 2026, Harvest Portfolios Group Inc. 2026 July 1-20
What about midterm elections?
The midterm election chart below illustrates a more subdued, choppier pattern than the presidential election chart. This stands to reason, given that the midterms typically carry less market-moving uncertainty than a change in the White House. The January to June period is the most volatile stretch, swinging from a strong 1998 rally to sharp declines in 2002 and especially 2022. This shows that broader macro conditions – the dot-com bust in 2002, and inflation/rate hikes in 2022 – tend to dominate over the midterm election itself.
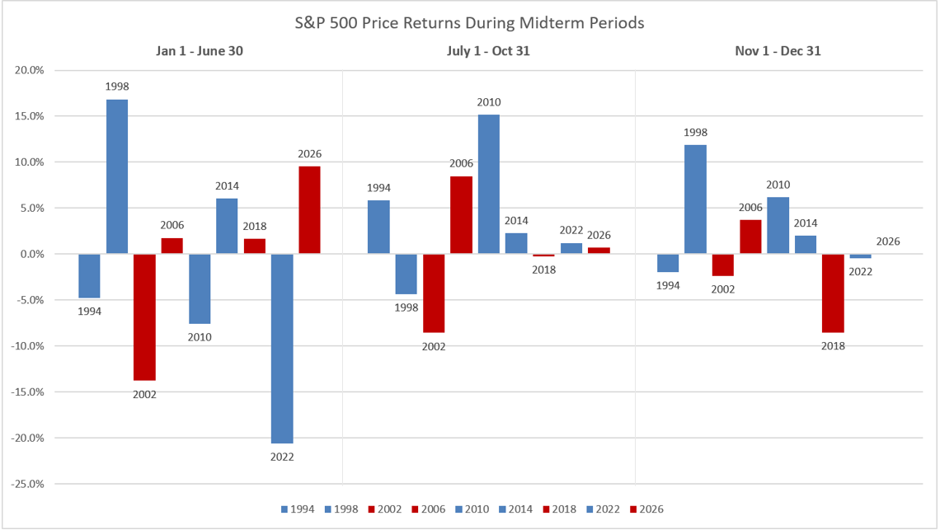
Red bars: Republican | Blue bars: Democratic
Source: Bloomberg, July 17, 2026. Harvest Portfolios Group Inc. 2026 July 1-20
By the July-October turn, returns are still mixed but somewhat calmer. The 2010 period posted a notably strong rebound and 2018 was flat to slightly negative. The early November to end of December window, which captures the immediate reaction to the midterm result, is generally positive across most cycles when we look at 1994, 998, 2006, 2010, and 2014. This suggests that markets tend to respond well once the outcome and uncertainty are resolved. However, 2002 and 2018 stand out as exceptions, likely driven by other headwinds during those periods.
Following best practices in this cycle
Formal statistical testing finds that almost none of the patterns above rise to statistical significance once tested rigorously. Most of what looks like a “pattern” in these charts can be read as descriptive history, rather than proven in effect. As stated in the analysis above, the years that were genuine outliers had significant macro events that were impacting markets.
There is one result that did hold up as statistically significant; the behaviour of the Volatility Index (VIX). Volatility has historically fallen by about 42% in Presidential-year July through October, versus rising about 10% in the mid-term year July-October period. This lines up and lends real statistical support to the chart-level observation that this window is genuinely more volatility prone in midterm years.
Sectors to watch
Presidential and midterm elections also have an impact on specific sectors, not just the broader market.
Health care: Sensitive to policy risks
For example, the Health Care sector performance of the S&P 500 differed by party in the pre-election-year window. Just as the broader market was impacted more by macro trends than by the election itself, the story is the same for health care. Moreover, there is no clean red-vs-blue split. Health care overperformed in some Republican-associated periods and underperformed in others, and the same inconsistency holds for Democratic cycles.
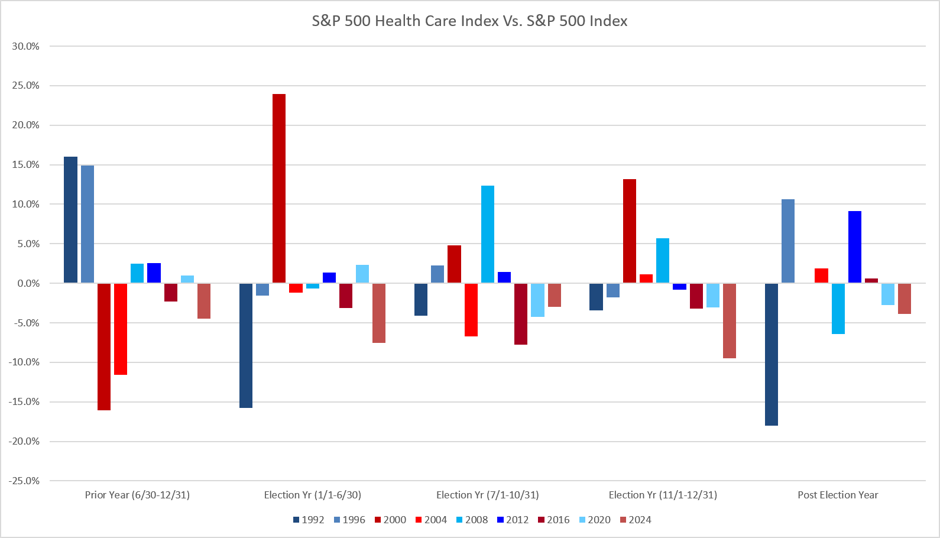
Red bars: Republican | Blue bars: Democratic
Source: Bloomberg, July 17, 2026. Harvest Portfolios Group Inc. 2026 July 1-July 20th
The years where health care did experience some volatility; 2000, 2008, and 2016, reflected market pricing in expectations around the sector regarding policy, drug pricing, or Affordable Care Act (ACA)-related regulatory risk. Healthcare looks like one of the more politically sensitive sectors around elections. However, the direction of that sensitivity depends heavily on the policy environment of each respective cycle.
Last month, Harvest ETFs President and Co-CIO Paul MacDonald provided an in-depth look at the healthcare sector as we approach the final months of 2026; Prescriptions for Relief: Signs of Recovery in Healthcare. Look at an abridged version of the report here.
The Harvest Healthcare Leaders Income ETF (TSX: HHL) is Canada’s largest healthcare income ETF. Its portfolio contains 20 large-cap global healthcare companies. HHL has delivered over a decade of consistent monthly income and last paid out a monthly cash distribution of $0.06 per unit.
Annual Performance
As at 2026/08/31
| Ticker | 1M | 3M | 6M | YTD | 1Y | 2Y | 3Y | 4Y | 5Y | 7Y | 8Y | 10Y | 11Y | SI |
|---|---|---|---|---|---|---|---|---|---|---|---|---|---|---|
| HHL | 3.77 | 11.26 | 1.89 | 3.29 | 12.82 | 0.55 | 6.98 | 8.70 | 6.02 | 9.41 | 7.41 | 7.58 | 7.26 | 6.92 |
| HHL.B | 2.77 | 12.41 | 4.51 | 5.53 | 15.94 | 3.71 | 9.45 | 11.52 | 9.13 | - | - | - | - | 10.54 |
| HHL.U | 3.95 | 11.82 | 2.86 | 4.51 | 14.89 | 2.27 | 8.53 | 10.03 | 7.10 | 10.53 | 8.50 | - | - | 9.39 |
Technology: Mostly immune to election noise
Technology has remained a red-hot sector throughout this decade, despite headlines warning of a potential “bubble”. The artificial intelligence boom has been the key driver, not just for technology but for the broader market. In late August, we discussed why the “expensive market” narrative is an assumption built upon questionable foundations. As this piece illustrates, market return has been driven by earnings growth. Valuation multiples have contracted through this period of price expansion.
Could the midterms be a catalyst in a negative direction? The historical record would cast doubt on that possibility.
The technology sector’s relative performance versus the S&P 500 across election cycles is that tech’s biggest swings have been tied to broader macro/tech-cycle forces. This is true through the dot-com boom/bust, the financial crisis and recovery, and the COVID-era tech rally.
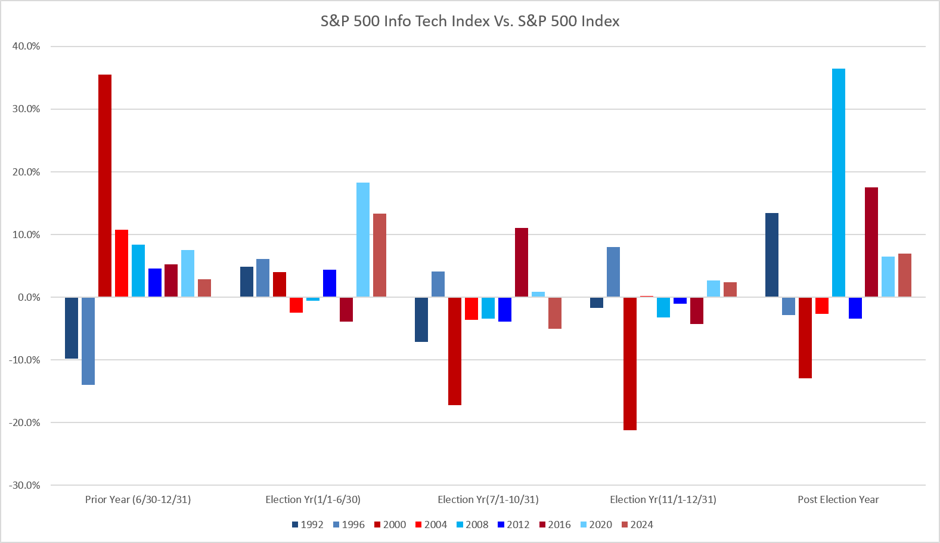
Red bars: Republican | Blue bars: Democratic
Source: Bloomberg, July 17, 2026. Harvest Portfolios Group Inc. 2026, July 1-20th.
Overall, technology looks more volatile and cycle-driven than healthcare, with no consistent Republican/Democratic tilt. Its performance around elections may be best explained by which broader technology or economic narrative happened to coincide with that cycle.
Unsurprisingly, tech-focused funds have delivered attractive returns over the course of this bull market. The Harvest Tech Leaders Income ETF (TSX: HTA)[i] offers exposure to 20 of the largest globally diversified technology leaders. It is overlaid with an active covered call strategy to generate monthly cash distributions. HTA last paid out a monthly cash distribution of $0.16 per unit.
Annual Performance
As at 2026/08/31
| Ticker | 1M | 3M | 6M | YTD | 1Y | 2Y | 3Y | 4Y | 5Y | 7Y | 8Y | 10Y | 11Y | SI |
|---|---|---|---|---|---|---|---|---|---|---|---|---|---|---|
| HTA | 5.27 | 1.18 | 31.31 | 25.06 | 32.52 | 21.16 | 24.13 | 25.45 | 14.40 | 20.65 | 18.28 | 19.29 | 18.56 | 16.82 |
| HTA.B | 4.19 | 2.14 | 34.69 | 27.91 | 36.42 | 25.17 | 27.08 | 28.93 | 18.06 | - | - | - | - | 23.48 |
| HTA.U | 5.38 | 1.61 | 32.57 | 26.68 | 35.18 | 23.44 | 26.02 | 27.21 | 15.86 | 22.28 | 19.85 | - | - | 20.37 |
Conclusion
The 2026 U.S. midterm elections could bring another period of uncertainty for investors. However, historical patterns suggest that markets are often influenced more by broader economic conditions than by election outcomes themselves. Looking back at previous midterm cycles, market performance has tended to be mixed in the run-up to elections but has often stabilized or improved once political uncertainty is resolved.
For investors, one takeaway from past cycles is that there’s limited historical evidence of a consistent pattern tied to which party wins. Some sectors, such as healthcare, have shown greater sensitivity to election-related policy risk, while others, like technology, appear to be driven more by broader economic and industry cycles than by political outcomes.
As the 2026 election approaches, some analysts suggest investors may be better served by focusing on fundamentals; earnings growth and the broader economic environment, rather than attempting to time markets based on political predictions.
Disclaimer
The views and/or opinions expressed above are of a general nature and are for informational purposes only. The contents should not be considered as advice and/or a recommendation to purchase or sell the mentioned securities or used to engage personal investment strategies.
Commissions, management fees and expenses all may be associated with investing in Harvest Exchange Traded Funds managed by Harvest Portfolios Group Inc. (the “Funds”). The Funds are not guaranteed, their values change frequently and past performance may not be repeated. Please read the relevant prospectus before investing.
The indicated rates of return are the historical annual compounded total returns (except for figures of one year or less, which are simple total returns) including changes in unit value and reinvestment of all distributions and do not take into account sales, redemption, distribution or optional charges or income taxes payable by any securityholder that would have reduced returns.
Certain statements included in this communication constitute forward-looking statements (“FLS”), including, but not limited to, those identified by the expressions “expect”, “intend”, “will” and similar expressions to the extent they relate to the Fund. The FLS are not historical facts but reflect Harvest’s, the Manager of the Fund, current expectations regarding future results or events. These FLS statements are subject to a number of risks and uncertainties that could cause actual results or events to differ materially from current expectations. Although Harvest, the Manager of the Fund, believes that the assumptions inherent in the FLS are reasonable, FLS are not guarantees of future performance and, accordingly, readers are cautioned not to place undue reliance on such statements due to the inherent uncertainty therein. Harvest, the Manager of the Fund, undertakes no obligation to update publicly or otherwise revise any FLS or information whether as a result of new information, future events or other such factors which affect this information, except as required by law.
[i] Formerly Harvest Tech Achievers Growth & Income ETF