By Ambrose O’Callaghan
Investing in artificial intelligence has been one of the defining market themes of the past several years. The latest earnings season suggests that the story still has legs. Indeed, the headline narrative in 2026 has been that markets “look expensive”. However, a closer look at what is driving returns tells a much different story. This rally is built on a foundation of real earnings power, not just a multiples expansion.
Earnings, not enthusiasm, moving the market
Back in March 2026, we discussed why large-cap technology equities still had room to run in this environment. The last several months have strengthened that point of view.
Recent weeks have shown the summer earnings season (June to August), not macro headlines, as the dominant market driver. We touched on this point in our most recent monthly commentary.
Microsoft’s strong quarter, which saw the software and cloud services giant earned an adjusted $4.74 per share on sales of US$90 billion, triggered one of the largest single-day market cap moves on record. Meanwhile, names like Amazon and Regeneron posted outsized days of their own. There are signs that market breadth is expanding beyond the usual mega-cap AI names. That momentum is bleeding into sectors like healthcare, while other sectors benefit from the broader technology buildout.
Harvest ETFs Co-CIO James Learmonth, CFA, has pushed back on the “market looks expensive” narrative directly. Indeed, as the charts below illustrate, when you break market returns down into their two components; earnings per share growth and multiple expansion, it is earnings growth that has outpaced price increases, not speculative re-rating.
Market Returns Broken Down by EPS & Multiples
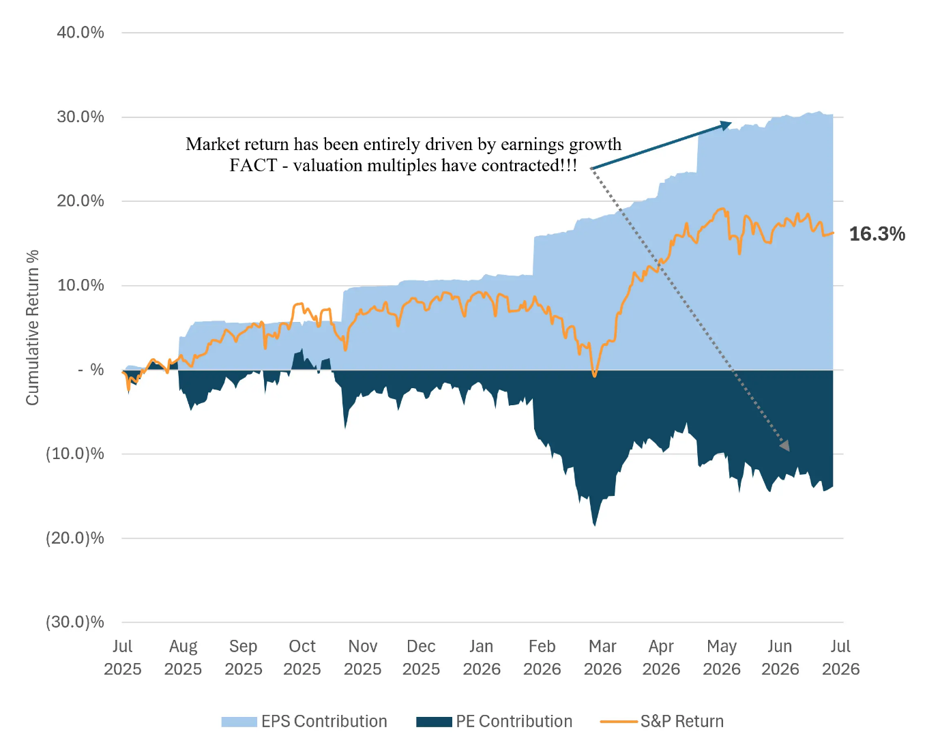
Source: Harvest ETFs, July 31, 2026. Bloomberg L.P., represents earnings multiple contraction that is driven by forward earnings growth estimates (4 quarter median) and from multiple contraction.
Forward P/E multiples are cheaper today than earlier in the year. That is not because prices have fallen. On the contrary, it is because earnings are accelerating faster than prices are rising. This is compressing multiples even as the market climbs.
Is it autumn for the AI story?
The earnings story reframes the AI investment thesis. At this stage, the story is not just about hyper-scalers spending exponentially more on compute, power, and infrastructure. We can break up the AI evolution into three stages; first from machine learning’s predictive power, then through generative AI’s creative capacity, and now increasingly there is a shift in AI from reactive tools that wait for prompts to autonomous systems that independently plan and execute multi-step workflows.
Big Tech Capital Expenditures
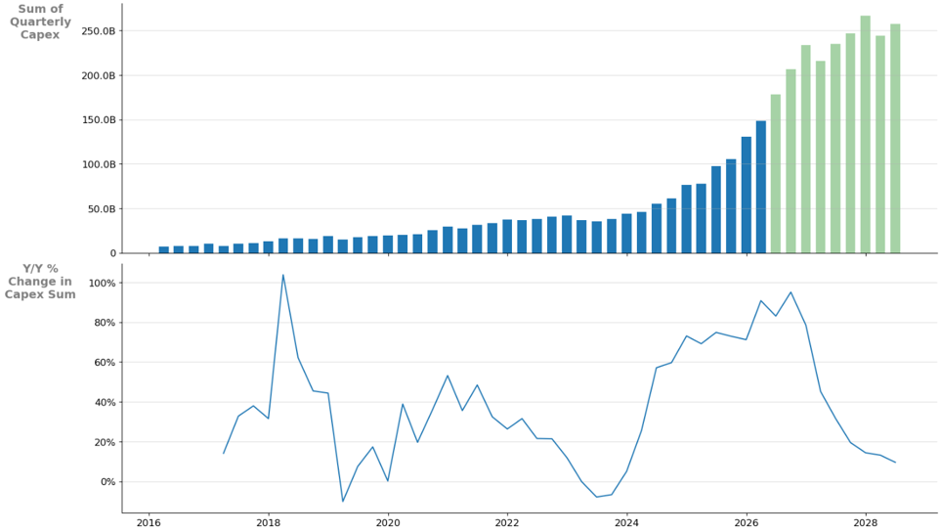
Source: Bloomberg LP, Harvest ETFs, latest available as of July 13, 2026. Note: Represents sum of quarterly capex for MSFT, AMZN, GOOGL, META, ORCL, Green bars represent consensus forecasts.
This broadening of earnings power is why the AI diversification argument is so strong. That said, the risks flagged throughout the AI investment conversation have not disappeared.
Risks like regulatory uncertainty, the sheer capital intensity of the buildout, index concentration in a small number of mega-cap names, and elevated (if improving) valuations all remain concerns going forward. Volatility is likely to continue, even as the underlying earnings trend looks constructive. Risk has not been resolved. However, the fundamentals underpinning the AI theme are more durable than the “expensive market” headlines suggest.
AI story ETFs to watch
The Harvest Tech Leaders Income ETF (TSX: HTA)[i] is an equally weighted portfolio of 20 large-cap technology companies that are diversified with a global footprint. Its portfolio contains big spenders in the AI space like Microsoft, Alphabet, Oracle, Meta, and chipmakers like Nvidia, Broadcom, and Micron Technology. HTA is overlaid with an active covered call option writing strategy, designed to generate high levels of monthly cash distributions.
Annual Performance
As at 2026/09/30
| Ticker | 1M | 3M | 6M | YTD | 1Y | 2Y | 3Y | 4Y | 5Y | 7Y | 8Y | 10Y | 11Y | SI |
|---|---|---|---|---|---|---|---|---|---|---|---|---|---|---|
| HTA | 2.94 | 2.23 | 40.71 | 28.75 | 30.71 | 21.20 | 27.33 | 30.79 | 16.31 | 21.19 | 18.66 | 19.38 | 19.16 | 16.99 |
| HTA.B | 5.84 | 2.98 | 45.24 | 35.39 | 36.35 | 26.66 | 31.31 | 33.54 | 20.61 | - | - | - | - | 24.22 |
| HTA.U | 3.07 | 2.63 | 41.97 | 30.57 | 33.34 | 23.48 | 29.29 | 32.54 | 17.83 | 22.85 | 20.23 | - | - | 20.56 |
For investors who are seeking even higher levels of income and growth potential, there is the Harvest Tech Leaders Enhanced Income ETF (TSX: HTAE)[ii]. HTAE provides enhanced exposure to HTA by applying modest leverage at around 25% to the same portfolio of technology leaders.
Annual Performance
Another tech-heavy ETF offered in the Harvest High Income Shares suite is the Harvest Diversified High Income Shares ETF (TSX: HHIS). This multi-sector portfolio is designed to capture a diverse selection of leading and trending companies that are positioned for strong growth. That includes stand out names in the technology space like NVIDIA, Alphabet, Microsoft, Apple, Amazon, and more.
Annual Performance
As at 2026/09/30
| Ticker | 1M | 3M | 6M | YTD | 1Y | SI |
|---|---|---|---|---|---|---|
| HHIS | 6.39 | 12.16 | 34.41 | 18.13 | 16.90 | 27.46 |
Summary
The message remains consistent as we inch closer to the end of the summer of 2026. AI remains a powerful, rapidly evolving theme. Moreover, the evidence from this earnings season; accelerating earnings, compressing multiples, and broadening market participations, lends strength to the view that the growth story still has legs. For investors, the opportunity is not to chase the theme through concentrated exposure. Rather, investors can seek to access it through diversified, income-generating solutions that can participate in the buildout while managing volatility that is likely to persist along the way. Investors can seek access to this burgeoning space through Harvest ETFs like HTA, HTAE, and HHIS.
Disclaimer
This communication should not be considered as advice and/or a recommendation to purchase or sell the mentioned securities or used to engage in personal investment strategies. Tax, investment and all other decisions should be made with guidance from a qualified professional.
Commissions, management fees and expenses all may be associated with investing in Harvest ETFs (the “Fund(s)” or “ETF(s)”) managed by Harvest Portfolios Group Inc. Please read the relevant prospectus before investing. The Funds are not guaranteed, their values change frequently and past performance may not be repeated. Tax, investment and all other decisions should be made with guidance from a qualified professional.
Distributions are paid to you in cash unless you request, pursuant to your participation in a distribution reinvestment plan, that they be reinvested into the Class of units that you own of the Fund. If the Fund earns less than the amounts distributed, the difference is a return of capital. Depending on the Fund’s mandate, distributions on the units, if any, may consist of income, including foreign source income, dividends from taxable Canadian corporations and capital gains, less the expenses and may include returns of capital.
The indicated rates of return are the historical annual compounded total returns (except for figures of one year or less, which are simple total returns) including changes in unit value and reinvestment of all distributions and do not take into account sales, redemption, distribution or optional charges or income taxes payable by any securityholder that would have reduced returns.
Certain statements included in this communication constitute forward-looking statements (“FLS”), including, but not limited to, those identified by the expressions "expect", "intend", "will" and similar expressions to the extent they relate to the Fund. The FLS are not historical facts but reflect Harvest’s, the Manager of the Fund, current expectations regarding future results or events. These FLS statements are subject to a number of risks and uncertainties that could cause actual results or events to differ materially from current expectations. Although Harvest, the Manager of the Fund, believes that the assumptions inherent in the FLS are reasonable, FLS are not guarantees of future performance and, accordingly, readers are cautioned not to place undue reliance on such statements due to the inherent uncertainty therein. Harvest, the Manager of the Fund, undertakes no obligation to update publicly or otherwise revise any FLS or information whether as a result of new information, future events or other such factors which affect this information, except as required by law.
[i] Formerly Harvest Tech Achievers Growth & Income ETF
[ii] Formerly Harvest Tech Achievers Enhanced Income ETF