
Distributions
| Last Distribution Per Unit: | $5.4581 |
| Last Ex-dividend Date: | 2025/12/31 |
| Last Record Date: | 2025/12/31 |
| Cash Distribution Frequency: | Annually, if any |
| Cash Distributions Since Inception*: | $0.9717 |
| Ex-dividend Date | Record Date | Payment Date | Class A | Distribution Frequency |
|---|---|---|---|---|
| 2025/12/31 | 2025/12/31 | 2025/12/31 | $5.4581 | Notional** |
| 2024/12/31 | 2024/12/31 | 2024/12/31 | $0.4418 | Notional** |
| 2023/12/28 | 2023/12/29 | 2023/12/29 | $2.4826 | Notional** |
| 2022/12/29 | 2022/12/30 | 2022/12/30 | $0.2331 | Notional** |
| 2021/12/30 | 2021/12/31 | 2021/12/31 | $1.1934 | Notional** |
| 2020/12/30 | 2020/12/31 | 2021/01/08 | $0.8376 | Special |
* Since Inception Date: 2019/01/15
** Notional non-cash distributions are paid annually (if any). There is no impact on net asset value per unit. The notional distribution is added to the cost base of the ETF and is taxable if not held in a registered account (RSP/RIF/TFSA and RESP).
2022
June 30, 2022 Interim Financial Statements | English
June 30, 2022 Interim Management Report of Fund Performance | English
June 30, 2022 Interim Financial Statements | French
June 30, 2022 Interim Management Report of Fund Performance | French
2021
December 31, 2021 Annual Financial Statements | English
December 31, 2021 Annual Management Report of Fund Performance | English
December 31, 2021 Annual Financial Statements | French
December 31, 2021 Annual Management Report of Fund Performance | French
September 30, 2021 Quarterly Portfolio Disclosure
June 30, 2021 Interim Financial Statements | English
June 30, 2021 Interim Management Report of Fund Performance | English
June 30, 2021 Interim Financial Statements | French
June 30, 2021 Interim Management Report of Fund Performance | French
March 31, 2021 Quarterly Portfolio Disclosure
2020
December 31, 2020 Annual Financial Statements | English
December 31, 2020 Annual Management Report of Fund Performance | English
December 31, 2020 Annual Financial Statements | French
December 31, 2020 Annual Management Report of Fund Performance | French
September 30, 2020 Quarterly Portfolio Disclosure
June 30, 2020 Harvest ETFs MERs
June 30, 2020 Interim Financial Statements | English
June 30, 2020 Interim Management Report of Fund Performance | English
June 30, 2020 Interim Financial Statements | French
June 30, 2020 Interim Management Report of Fund Performance | French
March 31, 2020 Quarterly Portfolio Disclosure
January 01, 2020 Harvest ETFs MERs
2019
December 31, 2019 Annual Financial Statements | English**
December 31, 2019 Annual Management Report of Fund Performance | English**
December 31, 2019 Annual Financial Statements | French**
December 31, 2019 Annual Management Report of Fund Performance | French**
September 30, 2019 Quarterly Portfolio Disclosure
June 30, 2019 Interim Financial Statements | English
June 30, 2019 Interim Management Report of Fund Performance | English
June 30, 2019 Interim Financial Statements | French
June 30, 2019 Interim Management Report of Fund Performance | French
June 30, 2019 Quarterly Portfolio Disclosure
March 31, 2019 Quarterly Portfolio Disclosure
2019
![]()
|
Total Distribution Not Including Notional Distributions |
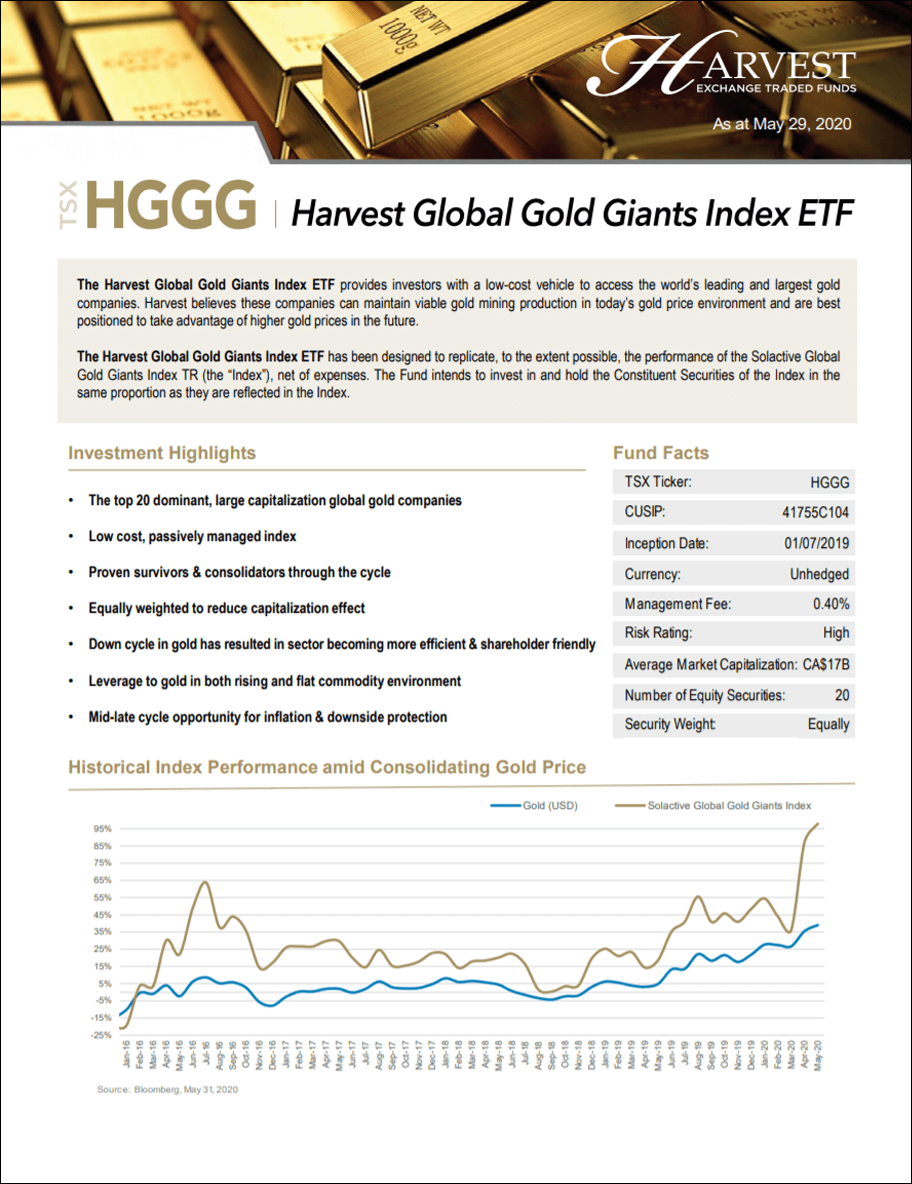
Why Invest In This Fund?
Harvest Global Gold Giants Index ETF is an equally weighted portfolio of the world’s leading and largest gold companies. The ETF tracks the Solactive Global Gold Giants Index TR.
|
Fund Quick Facts
| As at June 30, 2026 |
| TSX Code | HGGG |
| Cusip | 41755C104 |
| Net AUM | $19.7 million |
| Currency | CAD-Unhedged |
| Management Fee | 0.40% |
| Number of Equity Securities | 20 |
| Distributions | Annually, if any |
| Distribution Method | Cash |
| Eligible | RRSP/RRIF/RESP/TFSA |
| Risk Rating | High |
Portfolio Analysis*
| As at June 30, 2026 |
| Average Market Capitalization (CAD) | $11B |
| Security Weight | Equally |
INTERACT NOW!
Portfolio Management
![]()
 |
PAUL MACDONALD, CFAChief Investment Officer |
 |
JAMES LEARMONTH, CFASenior Portfolio Manager |
 |
MIKE DRAGOSITS, CFAPortfolio Manager |
Historical Prices
Portfolio Holdings
| As at June 30, 2026 |
| Name | Ticker | Weight | Sector | Country |
|---|---|---|---|---|
| DPM Metals Inc. | DPM CN | 5.6% | Gold | Canada |
| Eldorado Gold Corporation | ELD CN | 5.5% | Gold | Canada |
| G Mining Ventures Corp. | GMIN CN | 5.5% | Gold | Canada |
| Coeur Mining, Inc. | CDE US | 5.4% | Gold | United States |
| IAMGOLD Corporation | IMG CN | 5.4% | Gold | Canada |
| Evolution Mining Limited | EVN AU | 5.3% | Gold | Australia |
| Lundin Gold Inc. | LUG CN | 5.2% | Gold | Canada |
| SSR Mining Inc. | SSRM US | 5.2% | Gold | Canada |
| Barrick Mining Corporation | ABX CN | 5.1% | Gold | Canada |
| Northern Star Resources Limited | NST AU | 5.1% | Gold | Australia |
| Agnico Eagle Mines Limited | AEM CN | 4.9% | Gold | Canada |
| AngloGold Ashanti PLC | AU US | 4.9% | Gold | United States |
| Newmont Corporation | NEM US | 4.9% | Gold | United States |
| Endeavour Mining PLC | EDV LN | 4.7% | Gold | United Kingdom |
| B2Gold Corp. | BTO CN | 4.6% | Gold | Canada |
| Kinross Gold Corporation | K CN | 4.6% | Gold | Canada |
| OceanaGold Corporation | OGC CN | 4.6% | Gold | Canada |
| Pan American Silver Corp. | PAAS CN | 4.6% | Silver | Canada |
| Equinox Gold Corp. | EQX CN | 4.4% | Gold | Canada |
| Alamos Gold Inc. | AGI CN | 4.3% | Gold | Canada |
| Cash and other assets and liabilities | 0.3% |
Geographic Allocation
| As at June 30, 2026 |
Performance (%)
| As at June 30, 2026 |
| Ticker | 1M | 3M | 6M | YTD | 1Y | 2Y | 3Y | 4Y | 5Y | 6Y | 7Y | SI |
|---|---|---|---|---|---|---|---|---|---|---|---|---|
| HGGG | (12.38) | (15.30) | (9.96) | (9.96) | 61.87 | 67.09 | 46.78 | 38.50 | 24.82 | 16.38 | 20.47 | 21.13 |
| Ticker | 2025 | 2024 | 2023 | 2022 | 2021 | 2020 | 2019 |
|---|---|---|---|---|---|---|---|
| HGGG | 168.18 | 26.68 | 4.02 | (4.43) | (13.97) | 29.04 | 24.11 |
Cumulative Growth $10,000 Invested
(NAV pricing)
Disclaimer
Harvest Global Gold Giants Index ETF
Commissions, management fees and expenses all may be associated with investing in Harvest Exchange Traded Funds (managed by Harvest Portfolios Group Inc.). Please read the relevant prospectus before investing. The indicated rates of return are the historical annual compounded total returns including changes in unit value and reinvestment of all distributions and do not take into account income taxes payable by any securityholder that would have reduced returns. The Fund is not guaranteed, its values changes frequently and past performance may not be repeated. Tax investment and all other decisions should be made with guidance from a qualified professional.
Solactive Indices
The financial instrument is not sponsored, promoted, sold or supported in any other manner by Solactive AG nor does Solactive AG offer any express or implicit guarantee or assurance either with regard to the results of using the Index and/or Index trade name or the Index Price at any time or in any other respect. The Index is calculated and published by Solactive AG. Solactive AG uses its best efforts to ensure that the Index is calculated correctly. Irrespective of its obligations towards the Issuer, Solactive AG has no obligation to point out errors in the Index to third parties including but not limited to investors and/or financial intermediaries of the financial instrument. Neither publication of the Index by Solactive AG northe licensing of the Index or Index trade name for the purpose of use in connection with the financial instrument constitutes a recommendation by Solactive AG to invest capital in said financial instrument nor does it in any way represent an assurance or opinion of Solactive AG with regard to any investment in this financial instrument.
**Filed on SEDAR April 01, 2020 per NI 81-503 Extension of Certain Filing, Delivery and Prospectus Renewal Requirements of Investment Funds.
† The first year of Calendar Year Performance presents the rate of return from commencement of operations to December 31 of that year.