
By Ambrose O’Callaghan
Historically, the health care sector has demonstrated both defensive and growth-oriented qualities. The sector is defensive because of the essential nature of its services. Its growth opportunities, which are compelling, are tied to the high demand for healthcare specialized products and technological innovations. However, for 2025, the story has been different as reflected in the Healthcare Index’s performance.
At the time of writing, August 14, 2025, the sector is the worst performing in the broader U.S. markets over the past year and on a global basis, it is the same story with the MSCI World Healthcare Index being down 9.8% over the past year.
We will use this article to closely examine the reasons for this slide in 2025, the path forward for the sector and the impacts to Canada’s largest healthcare ETF – the Harvest Healthcare Leaders Income ETF (HHL:TSX).
Headwinds in healthcare
The healthcare sector has battled several headwinds through 2025, and some remain in the space that may apply pressure to broader healthcare stocks going forward. Headline and policy risks are two major factors that have frustrated the markets since late 2024 up to and including early 2025. The sector performed relatively well during the first quarter of 2025 compared to the market. However, as these tariff and policy headwinds and headlines filtered through the sector, it came under pressure through the summer months.
As we pass through the midway point in August, investors are seeking the catalysts for a recovery and keeping an eye out for signs of a bottom. There are six core drivers of headline and policy risks that have created headwinds for the sector this year:
- Tariffs: Healthcare was the best-performing sector to the end of March 2025 and was seen as relatively immune to the tariff threat. That was until the “200% tariff” threat on the pharmaceutical sub-sector. Fortunately, this narrative has been walked back to a degree. The medical technology subsector has benefitted from less noise in this space. Looking ahead, it appears unlikely that tariffs will have an outsized impact ahead of the mid-terms in 2026.
- Most Favored Nation (MFN) Pricing Model: This proposed policy would tie U.S. drug prices to the lowest in the Organization for Economic Co-operation and Development (OECD). The model will remain a headline risk going forward. It is noteworthy that a much narrower pilot project in 2020 failed due to legal recourse. Investors should expect political and legal pushback to limit its application.
- Inflation Reduction Act (IRA): The Biden-era legislation allows Medicare to negotiate prices for certain high-cost drugs. For now, the market is aware and sees it as a clearing event with pricing coming in better than originally feared. Names like Novo Nordisk are more heavily impacted given Medicare/Medicaid spend.
- One Big Beautiful Bill Act (OBBBA): This new legislation aims at significant changes to Medicare and Medicaid. However, that implementation is to take place over a 10-year period. Although the bill passed, we are highly unlikely to see these changes being implemented given the reduced coverage for millions that would result, as well as the increase in costs for healthcare providers if they choose to stay in more remote areas.
- RFK Jr.: The current U.S. Secretary of Health and Human Services has stirred uncertainty in the space given his anti-vaccine perspectives. He has already made significant changes to research funding, as well as changes to leadership within the Centers for Medicare & Medicaid Services (CMS) and the U.S. Food and Drug Administration (FDA). The politicization of healthcare, and potential legal challenges to funding and department changes, remains a policy uncertainty adding to negative sentiment.
- Managed Care: This is a case of higher utilization that originally forecast for higher cost treatments. We can expect to see clarity into 2027 as we come through the third quarter as a timing catalyst, although institutional investor interest appears to be increasing and could also serve as a catalyst for an earlier recovery.
Healthcare Bright spots and Investor Sentiments
Weight watching | Progress for Eli Lilly
Eli Lilly has dominated the GLP-1/weight loss drug market. Despite this impressive run, the stock is down over 25% in the year-over-year period as of late afternoon trading on August 14, 2025. Novo Nordisk, which is not a constituent in HHL, is also a market leader in the GLP-1 space. It has suffered a steeper retracement over the same period, while also falling behind regarding its commercial results compared to Eli Lilly.
This commercial success was exemplified in Eli Lilly’s most recent earnings report. That release saw the company announce a huge beat that went far above expectations. The company’s revenue rose 38% year-over-year to $15.56 billion – driven by volume growth from Zepbound and Mounjaro. Moreover, Q2 earnings per share (EPS) surged 92% to US$6.29 on a reported basis and rose 61% on a non-GAAP basis to US$6.31.
At this stage, we expect Eli Lilly to continue to be best in class in the GLP-1 space. The company currently sits at ~60% of the total obesity market and growing.
The Global Anti-Obesity Medication Market May Touch $120 Billion by 2035

Source: Goldman Sachs Group Inc., 2025.
Healthcare sector sentiment
Let’s now have a look at current valuations and the opportunities that exist. From a historical perspective, the broader market volatility can experience a seasonal increase in the month of September. In our most recent monthly commentary, we reiterated the point that high valuations do not serve as catalysts for market corrections, nor do low valuations indicate the start of a bull market. This phenomenon is important to keep in mind when we look at the forward price-to-earnings multiples in the healthcare space.
Healthcare is trading at one of its widest valuation spreads, relative to the broader market, in decades. Despite the seemingly attractive valuations, there is no telling when we will see a bottom or a catalyst for an upward reversal.
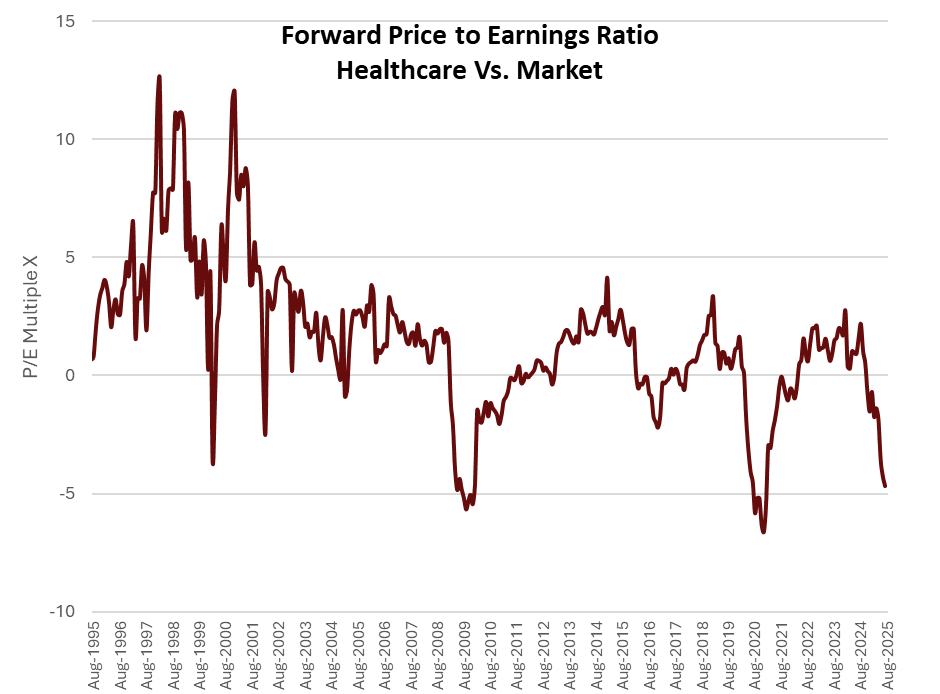
Source: Harvest Portfolios Group, Inc. Bloomberg, as at July 31, 2025. MSCI World Healthcare Index Average Premium/Discount to MSCI World Index, Forward 4 Quarters Consensus P/E.
Where Canada’s largest healthcare ETF is headed
The broader sector, and many underlying healthcare stocks, have technical indicators that are indicating oversold conditions and low valuations, as the chart above indicates. However, investors will need to be cognizant of headline and policy risks as they await positive short-term catalysts that can improve overall sentiment.
As noted above, the summer thus far has seen the sector being guided by headline and policy fears that are applying downward pressure. However, over the long term, healthcare continues to benefit from key drivers of ageing population, developing markets trend and technological innovations. In addition, it has garnered support from attractive relative valuations. In fact, excluding the COVID-19 pandemic, valuation multiples have not been this attractive since the 1990s.
One catalyst could in fact be renewed interest from institutional investors. This is evident with the recent announcement that Warren Buffett, a legendary long-term investor, had added to the sector. This announcement served to ignite a rally in the sector in the very short term.
This environment is challenging, but also rife with potential opportunities. Opportunities that investors could access through HHL. HHL provides access to an equal-weighted portfolio of 20 large-cap global healthcare companies. It provides steady monthly income and has paid the same and increased distribution rate each month for over ten years. It last paid out a monthly cash distribution of $0.06 per unit.
For investors who want exposure to healthcare with even more torque on the income and return side, there is the Harvest Healthcare Leaders Enhanced Income ETF (HHLE:TSX). This ETF aims to generate enhanced income and growth opportunities by applying modest leverage to an investment in HHL. HHLE last paid out a monthly cash distribution of $0.0934 per unit.
Disclaimer
The content of this article is meant to provide general information for educational purposes and should not be construed as investment advice. Commissions, management fees and expenses all may be associated with investing in Harvest Exchange Traded Funds (managed by Harvest Portfolios Group Inc.). Please read the relevant prospectus before investing. The funds are not guaranteed, their values change frequently, and past performance may not be repeated. Tax investment and all other decisions should be made with guidance from a qualified professional.
Certain statements included in this communication constitute forward-looking statements (“FLS”), including, but not limited to, those identified by the expressions “expect”, “intend”, “will” and similar expressions to the extent they relate to the Fund. The FLS are not historical facts but reflect Harvest’s, the Manager of the Fund, current expectations regarding future results or events. These FLS statements are subject to a number of risks and uncertainties that could cause actual results or events to differ materially from current expectations. Although Harvest, the Manager of the Fund, believes that the assumptions inherent in the FLS are reasonable, FLS are not guarantees of future performance and, accordingly, readers are cautioned not to place undue reliance on such statements due to the inherent uncertainty therein. Harvest, the Manager of the Fund, undertakes no obligation to update publicly or otherwise revise any FLS or information whether as a result of new information, future events or other such factors which affect this information, except as required by law.
MSCI. Certain information contained herein (the “Information”) is sourced from/copyright of MSCI Inc., MSCI ESG Research LLC, or their affiliates (“MSCI”), or information providers (together the “MSCI Parties”) and may have been used to calculate scores, signals, or other indicators. The Information is for internal use only and may not be reproduced or disseminated in whole or part without prior written permission. The Information may not be used for, nor does it constitute, an offer to buy or sell, or a promotion or recommendation of, any security, financial instrument or product, trading strategy, or index, nor should it be taken as an indication or guarantee of any future performance. Some funds may be based on or linked to MSCI indexes, and MSCI may be compensated based on the fund’s assets under
management or other measures. MSCI has established an information barrier between index research and certain Information. None of the Information in and of itself can be used to determine which securities to buy or sell or when to buy or sell them. The Information is provided “as is” and the user assumes the entire risk of any use it may make or permit to be made of the Information. No MSCI Party warrants or guarantees the originality, accuracy and/or completeness of the Information and each expressly disclaims all express or implied warranties. No MSCI Party shall have any liability for any errors or omissions in connection with any Information herein, or any liability for any direct, indirect, special, punitive, consequential or any other damages (including lost profits) even if notified of the possibility of such damages.