Key Facts
As at 2024/07/26
TICKER
HPF
TSX
CURRENCY
CAD
Hedged
NAV
$3.47
Updated Daily
MKT PRICE CLOSE
$3.48
Updated Daily
NET AUM*
$43.07M
Updated Daily
MGMT STYLE
Active
With Covered Calls
CASH DISTRIBUTION
Monthly
Frequency
LAST DISTRIBUTION
$0.0250
Cash, Per Unit
CURRENT YIELD
8.62%
Updated Daily
DISTRIBUTION
$4.0954
Total, Since Inception**
Key Facts
As at 2024/07/26
TICKER
HPF.U
TSX
CURRENCY
USD
Unhedged
NAV
$4.23
Updated Daily
MKT PRICE CLOSE
$4.23
Updated Daily
NET AUM*
$43.07M
Updated Daily
MGMT STYLE
Active
With Covered Calls
CASH DISTRIBUTION
Monthly
Frequency
LAST DISTRIBUTION
$0.0250
Cash, Per Unit
CURRENT YIELD
7.09%
Updated Daily
DISTRIBUTION
$4.0954
Total, Since Inception**
Key Facts
As at 2024/07/26
TICKER
HPF
TSX
CURRENCY
CAD
Hedged
NAV
$3.47
Updated Daily
MKT PRICE CLOSE
$3.48
Updated Daily
NET AUM*
$43.07M
Updated Daily
MGMT STYLE
Active
With Covered Calls
CASH DISTRIBUTIONS
Monthly
Frequency
LAST DISTRIBUTION
$0.0250
Cash, Per Unit
CURRENT YIELD
8.62%
Updated Daily
DISTRIBUTION
$4.0954
Total, Since Inception**
Key Facts
As at 2024/07/26
TICKER
HPF.U
TSX
CURRENCY
USD
Unhedged
NAV
$4.23
Updated Daily
MKT PRICE CLOSE
$4.23
Updated Daily
NET AUM*
$43.07M
Updated Daily
MGMT STYLE
Active
With Covered Calls
CASH DISTRIBUTIONS
Monthly
Frequency
LAST DISTRIBUTION
$0.0250
Cash, Per Unit
CURRENT YIELD
7.09%
Updated Daily
DISTRIBUTION
$4.0954
Total, Since Inception**
Distributions
|
Last Cash Distribution Per Unit: $0.0250 |
|
Last Ex-dividend Date: 2024/06/28 |
|
Last Record Date: 2024/06/28 |
|
Last Payment Date: 2024/07/09 |
|
Cash Distribution Frequency: Monthly |
|
Cash Distributions Since Inception (Class A)**: CA$4.0954 |
|
Cash Distributions Since Inception (Class U)**: US$4.0954 |
| Ex-dividend Date | Record Date | Payment Date | Class A (CAD) | Class U (USD) | Distribution Frequency |
|---|---|---|---|---|---|
| 2024/06/28 | 2024/06/28 | 2024/07/09 | $0.0250 | $0.0250 | Monthly |
| 2024/05/31 | 2024/05/31 | 2024/06/07 | $0.0250 | $0.0250 | Monthly |
| 2024/04/29 | 2024/04/30 | 2024/05/09 | $0.0250 | $0.0250 | Monthly |
| 2024/03/27 | 2024/03/28 | 2024/04/09 | $0.0250 | $0.0250 | Monthly |
| 2024/02/28 | 2024/02/29 | 2024/03/08 | $0.0250 | $0.0250 | Monthly |
| 2024/01/30 | 2024/01/31 | 2024/02/09 | $0.0250 | $0.0250 | Monthly |
| Ex-dividend Date | Record Date | Payment Date | Class A (CAD) | Class U (USD) | Distribution Frequency |
|---|---|---|---|---|---|
| 2023/12/28 | 2023/12/29 | 2024/01/09 | $0.0250 | $0.0250 | Monthly |
| 2023/11/29 | 2023/11/30 | 2023/12/08 | $0.0250 | $0.0250 | Monthly |
| 2023/10/30 | 2023/10/31 | 2023/11/09 | $0.0250 | $0.0250 | Monthly |
| 2023/09/28 | 2023/09/29 | 2023/10/06 | $0.0250 | $0.0250 | Monthly |
| 2023/08/30 | 2023/08/31 | 2023/09/08 | $0.0250 | $0.0250 | Monthly |
| 2023/07/28 | 2023/07/31 | 2023/08/09 | $0.0250 | $0.0250 | Monthly |
| 2023/06/29 | 2023/06/30 | 2023/07/07 | $0.0250 | $0.0250 | Monthly |
| 2023/05/30 | 2023/05/31 | 2023/06/09 | $0.0250 | $0.0250 | Monthly |
| 2023/04/27 | 2023/04/28 | 2023/05/09 | $0.0250 | $0.0250 | Monthly |
| 2023/03/30 | 2023/03/31 | 2023/04/06 | $0.0250 | $0.0250 | Monthly |
| 2023/02/27 | 2023/02/28 | 2023/03/09 | $0.0250 | $0.0250 | Monthly |
| 2023/01/30 | 2023/01/31 | 2023/02/09 | $0.0250 | $0.0250 | Monthly |
| Ex-dividend Date | Record Date | Payment Date | Class A (CAD) | Class U (USD) | Distribution Frequency |
|---|---|---|---|---|---|
| 2022/12/29 | 2022/12/30 | 2023/01/09 | $0.0250 | $0.0250 | Monthly |
| 2022/11/29 | 2022/11/30 | 2022/12/09 | $0.0250 | $0.0250 | Monthly |
| 2022/10/28 | 2022/10/31 | 2022/11/09 | $0.0250 | $0.0250 | Monthly |
| 2022/09/28 | 2022/09/29 | 2022/10/07 | $0.0250 | $0.0250 | Monthly |
| 2022/08/30 | 2022/08/31 | 2022/09/09 | $0.0250 | $0.0250 | Monthly |
| 2022/07/28 | 2022/07/29 | 2022/08/09 | $0.0250 | $0.0250 | Monthly |
| 2022/06/29 | 2022/06/30 | 2022/07/08 | $0.0150 | $0.0150 | Monthly |
| 2022/05/30 | 2022/05/31 | 2022/06/09 | $0.0150 | $0.0150 | Monthly |
| 2022/04/28 | 2022/04/29 | 2022/05/09 | $0.0150 | $0.0150 | Monthly |
| 2022/03/30 | 2022/03/31 | 2022/04/08 | $0.0150 | $0.0150 | Monthly |
| 2022/02/25 | 2022/02/28 | 2022/03/09 | $0.0150 | $0.0150 | Monthly |
| 2022/01/28 | 2022/01/31 | 2022/02/09 | $0.0150 | $0.0150 | Monthly |
| Ex-dividend Date | Record Date | Payment Date | Class A (CAD) | Class U (USD) | Distribution Frequency |
|---|---|---|---|---|---|
| 2021/12/30 | 2021/12/31 | 2022/01/07 | $0.0150 | $0.0150 | Monthly |
| 2021/11/29 | 2021/11/30 | 2021/12/09 | $0.0150 | $0.0150 | Monthly |
| 2021/10/28 | 2021/10/29 | 2021/11/09 | $0.0100 | $0.0100 | Monthly |
| 2021/09/28 | 2021/09/30 | 2021/10/08 | $0.0100 | $0.0100 | Monthly |
| 2021/08/30 | 2021/08/31 | 2021/09/09 | $0.0100 | $0.0100 | Monthly |
| 2021/07/29 | 2021/07/30 | 2021/08/09 | $0.0100 | $0.0100 | Monthly |
| 2021/06/29 | 2021/06/30 | 2021/07/09 | $0.0100 | $0.0100 | Monthly |
| 2021/05/28 | 2021/05/31 | 2021/06/09 | $0.0100 | $0.0100 | Monthly |
| 2021/04/29 | 2021/04/30 | 2021/05/07 | $0.0100 | $0.0100 | Monthly |
| 2021/03/30 | 2021/03/31 | 2021/04/09 | $0.0100 | $0.0100 | Monthly |
| 2021/02/25 | 2021/02/26 | 2021/03/09 | $0.0100 | $0.0100 | Monthly |
| 2021/01/28 | 2021/01/29 | 2021/02/09 | $0.0100 | $0.0100 | Monthly |
| Ex-dividend Date | Record Date | Payment Date | Class A (CAD) | Class U (USD) | Distribution Frequency |
|---|---|---|---|---|---|
| 2020/12/30 | 2020/12/31 | 2021/01/08 | $0.0100 | $0.0100 | Monthly |
| 2020/11/27 | 2020/11/30 | 2020/12/09 | $0.0300 | $0.0300 | Monthly |
| 2020/10/29 | 2020/10/30 | 2020/11/09 | $0.0300 | $0.0300 | Monthly |
| 2020/09/29 | 2020/09/30 | 2020/10/09 | $0.0300 | $0.0300 | Monthly |
| 2020/08/28 | 2020/08/31 | 2020/09/09 | $0.0300 | $0.0300 | Monthly |
| 2020/07/30 | 2020/07/31 | 2020/08/07 | $0.0300 | $0.0300 | Monthly |
| 2020/06/29 | 2020/06/30 | 2020/07/09 | $0.0300 | $0.0300 | Monthly |
| 2020/05/28 | 2020/05/29 | 2020/06/09 | $0.0300 | $0.0300 | Monthly |
| 2020/04/29 | 2020/04/30 | 2020/05/08 | $0.0300 | $0.0300 | Monthly |
| 2020/03/30 | 2020/03/31 | 2020/04/09 | $0.0300 | $0.0300 | Monthly |
| 2020/02/27 | 2020/02/28 | 2020/03/09 | $0.0300 | $0.0300 | Monthly |
| 2020/01/30 | 2020/01/31 | 2020/02/07 | $0.0300 | $0.0300 | Monthly |
| Ex-dividend Date | Record Date | Payment Date | Class A (CAD) | Class U (USD) | Distribution Frequency |
|---|---|---|---|---|---|
| 2019/12/30 | 2019/12/31 | $0.0300 | $0.0300 | Monthly | |
| 2019/11/28 | 2019/11/29 | $0.0300 | $0.0300 | Monthly | |
| 2019/10/30 | 2019/10/31 | $0.0300 | $0.0300 | Monthly | |
| 2019/09/27 | 2019/09/30 | $0.0300 | $0.0300 | Monthly | |
| 2019/08/29 | 2019/08/30 | $0.0300 | $0.0300 | Monthly | |
| 2019/07/30 | 2019/07/31 | $0.0300 | $0.0300 | Monthly | |
| 2019/06/27 | 2019/06/28 | $0.0300 | $0.0300 | Monthly | |
| 2019/05/30 | 2019/05/31 | $0.0300 | $0.0300 | Monthly | |
| 2019/04/29 | 2019/04/30 | $0.0300 | $0.0300 | Monthly | |
| 2019/03/28 | 2019/03/29 | $0.0300 | $0.0300 | Monthly | |
| 2019/02/27 | 2019/02/28 | $0.0300 | $0.0300 | Monthly | |
| 2019/01/30 | 2019/01/31 | $0.0300 | $0.0300 | Monthly |
| Ex-dividend Date | Record Date | Payment Date | Class A (CAD) | Class U (USD) | Distribution Frequency |
|---|---|---|---|---|---|
| 2018/12/28 | 2018/12/31 | $0.0300 | $0.0300 | Monthly | |
| 2018/11/29 | 2018/11/30 | $0.0300 | $0.0300 | Monthly | |
| 2018/10/30 | 2018/10/31 | $0.0300 | $0.0300 | Monthly | |
| 2018/09/27 | 2018/09/28 | $0.0300 | $0.0300 | Monthly | |
| 2018/08/30 | 2018/08/31 | $0.0300 | $0.0300 | Monthly | |
| 2018/07/30 | 2018/07/31 | $0.0300 | $0.0300 | Monthly | |
| 2018/06/28 | 2018/06/29 | $0.0300 | $0.0300 | Monthly | |
| 2018/05/30 | 2018/05/31 | $0.0300 | $0.0300 | Monthly | |
| 2018/04/27 | 2018/04/30 | $0.0300 | $0.0300 | Monthly | |
| 2018/03/28 | 2018/03/29 | $0.0300 | $0.0300 | Monthly | |
| 2018/02/27 | 2018/02/28 | $0.0300 | $0.0300 | Monthly | |
| 2018/01/30 | 2018/01/31 | $0.0300 | $0.0300 | Monthly |
| Ex-dividend Date | Record Date | Payment Date | Class A (CAD) | Class U (USD) | Distribution Frequency |
|---|---|---|---|---|---|
| 2017/12/28 | 2017/12/29 | $0.0583 | $0.0583 | Monthly | |
| 2017/11/29 | 2017/11/30 | $0.0583 | $0.0583 | Monthly | |
| 2017/10/30 | 2017/10/31 | $0.0583 | $0.0583 | Monthly | |
| 2017/09/28 | 2017/09/29 | $0.0583 | $0.0583 | Monthly | |
| 2017/08/29 | 2017/08/31 | $0.0583 | $0.0583 | Monthly | |
| 2017/07/27 | 2017/07/31 | $0.0583 | $0.0583 | Monthly | |
| 2017/06/28 | 2017/06/30 | $0.0583 | $0.0583 | Monthly | |
| 2017/05/29 | 2017/05/31 | $0.0583 | $0.0583 | Monthly | |
| 2017/04/26 | 2017/04/28 | $0.0583 | $0.0583 | Monthly | |
| 2017/03/29 | 2017/03/31 | $0.0583 | $0.0583 | Monthly | |
| 2017/02/24 | 2017/02/28 | $0.0583 | $0.0583 | Monthly | |
| 2017/01/27 | 2017/01/31 | $0.0583 | $0.0583 | Monthly |
| Ex-dividend Date | Record Date | Payment Date | Class A (CAD) | Class U (USD) | Distribution Frequency |
|---|---|---|---|---|---|
| 2016/12/28 | 2016/12/30 | $0.0583 | $0.0583 | Monthly | |
| 2016/11/28 | 2016/11/30 | $0.0583 | $0.0583 | Monthly | |
| 2016/10/27 | 2016/10/31 | $0.0583 | $0.0583 | Monthly | |
| 2016/09/28 | 2016/09/30 | $0.0583 | $0.0583 | Monthly | |
| 2016/08/29 | 2016/08/31 | $0.0583 | $0.0583 | Monthly | |
| 2016/07/27 | 2016/07/29 | $0.0583 | $0.0583 | Monthly | |
| 2016/06/28 | 2016/06/30 | $0.0583 | $0.0583 | Monthly | |
| 2016/05/27 | 2016/05/31 | $0.0583 | $0.0583 | Monthly | |
| 2016/04/27 | 2016/04/29 | $0.0583 | $0.0583 | Monthly | |
| 2016/03/29 | 2016/03/31 | $0.0583 | $0.0583 | Monthly | |
| 2016/02/25 | 2016/02/29 | $0.0583 | $0.0583 | Monthly | |
| 2016/01/27 | 2016/01/29 | $0.0583 | $0.0583 | Monthly |
| Ex-dividend Date | Record Date | Payment Date | Class A (CAD) | Class U (USD) | Distribution Frequency |
|---|---|---|---|---|---|
| 2015/12/29 | 2015/12/31 | $0.0583 | $0.0583 | Monthly | |
| 2015/11/26 | 2015/11/30 | $0.0583 | $0.0583 | Monthly | |
| 2015/10/28 | 2015/10/30 | $0.0583 | $0.0583 | Monthly | |
| 2015/09/28 | 2015/09/30 | $0.0583 | $0.0583 | Monthly | |
| 2015/08/27 | 2015/08/31 | $0.0583 | $0.0583 | Monthly | |
| 2015/07/29 | 2015/07/31 | $0.0583 | $0.0583 | Monthly | |
| 2015/06/26 | 2015/06/30 | $0.0583 | $0.0583 | Monthly | |
| 2015/05/27 | 2015/05/29 | $0.0583 | $0.0583 | Monthly | |
| 2015/04/28 | 2015/04/30 | $0.0583 | $0.0583 | Monthly | |
| 2015/03/27 | 2015/03/31 | $0.0583 | $0.0583 | Monthly | |
| 2015/02/25 | 2015/02/27 | $0.0583 | $0.0583 | Monthly | |
| 2015/01/28 | 2015/01/30 | $0.0583 | $0.0583 | Monthly |
| Ex-dividend Date | Record Date | Payment Date | Class A (CAD) | Class U (USD) | Distribution Frequency |
|---|---|---|---|---|---|
| 2014/12/29 | 2014/12/31 | $0.0583 | $0.0583 | Monthly | |
| 2014/11/26 | 2014/11/28 | $0.0583 | $0.0583 | Monthly |
Portfolio Analysis‡
As at June 28, 2024
|
Number of Equity Securities: 20 |
|
Average Market Capitalization (CAD): $145B |
|
Average P/E: 10.8x |
|
Average Dividend Yield: 4.24% |
|
Average 5 Year Return on Equity: 14.87% |
|
. |
|
As at June 28, 2024 |
|
As at June 28, 2024 |
Holdings
As at June 28, 2024
| Name | Ticker | Weight | Sector | Country |
|---|---|---|---|---|
| Pembina Pipeline Corporation | PPL CN | 5.4% | Oil & Gas Storage & Transportation | Canada |
| Equinor ASA | EQNR US | 5.2% | Integrated Oil & Gas | United States |
| Shell PLC | SHEL US | 5.2% | Integrated Oil & Gas | United States |
| Enbridge Inc. | ENB CN | 5.1% | Oil & Gas Storage & Transportation | Canada |
| Suncor Energy Inc. | SU CN | 5.1% | Integrated Oil & Gas | Canada |
| TC Energy Corporation | TRP CN | 5.1% | Oil & Gas Storage & Transportation | Canada |
| BP PLC | BP US | 5.0% | Integrated Oil & Gas | United States |
| Exxon Mobil Corporation | XOM US | 5.0% | Integrated Oil & Gas | United States |
| Schlumberger Limited | SLB US | 5.0% | Oil & Gas Equipment & Services | United States |
| Canadian Natural Resources Limited | CNQ CN | 4.9% | Oil & Gas Exploration & Production | Canada |
| Chevron Corporation | CVX US | 4.9% | Integrated Oil & Gas | United States |
| Eni S.p.A. | E US | 4.9% | Integrated Oil & Gas | United States |
| EOG Resources, Inc. | EOG US | 4.9% | Oil & Gas Exploration & Production | United States |
| Valero Energy Corporation | VLO US | 4.9% | Oil & Gas Refining & Marketing | United States |
| APA Corporation | APA US | 4.8% | Oil & Gas Exploration & Production | United States |
| TotalEnergies SE | TTE US | 4.8% | Integrated Oil & Gas | United States |
| Murphy Oil Corporation | MUR US | 4.7% | Oil & Gas Exploration & Production | United States |
| Ovintiv Inc. | OVV US | 4.7% | Oil & Gas Exploration & Production | United States |
| Phillips 66 | PSX US | 4.7% | Oil & Gas Refining & Marketing | United States |
| ConocoPhillips | COP US | 4.6% | Oil & Gas Exploration & Production | United States |
| Cash and other assets and liabilities | 1.5% | |||
| Foreign currency forwards | 0.0% | |||
| Market value of options | (0.5)% |
Annualized Performance
As at June 30, 2024
| Ticker | 1M | 3M | 6M | YTD | 1Y | 2Y | 3Y | 4Y | 5Y | 7Y | 8Y | SI |
|---|---|---|---|---|---|---|---|---|---|---|---|---|
| HPF | (2.20) | (2.33) | 4.45 | 4.45 | 14.40 | 10.60 | 15.03 | 19.30 | 4.35 | 3.08 | 2.64 | (0.83) |
| HPF.U | (2.25) | (2.39) | 3.84 | 3.84 | 14.13 | 10.57 | 14.89 | 20.17 | 5.46 | 4.29 | 3.80 | 0.42 |
Calendar Year Performance †
As at June 30, 2024
| Ticker | 2023 | 2022 | 2021 | 2020 | 2019 | 2018 | 2017 | 2016 | 2015 | 2014 |
|---|---|---|---|---|---|---|---|---|---|---|
| HPF | 2.52 | 38.28 | 34.63 | (38.08) | 9.63 | (18.29) | (0.36) | 27.43 | (25.99) | (11.25) |
| HPF.U | 3.76 | 36.89 | 36.18 | (35.59) | 11.58 | (17.74) | 1.49 | 31.02 | (25.62) | (11.29) |
Cumulative Market Price#
(Monthly Distribution: $0.0250)
Cumulative Growth $10,000 Invested
(NAV pricing)
The “Growth of $10,000 invested” chart shows the final value of a hypothetical $10,000 investment in securities in this class/series of the fund as at the end of the investment period indicated and is not intended to reflect future values or returns on investment in such securities.
HPF Historical Daily Prices (CLICK HERE)
Documents
 |
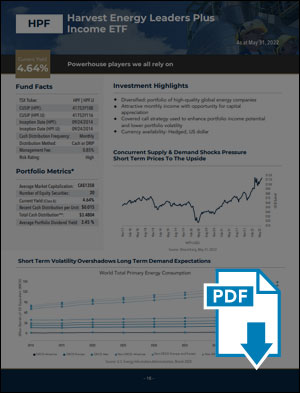
| Product Sheet |
 |
| Investor Brochure |
 |
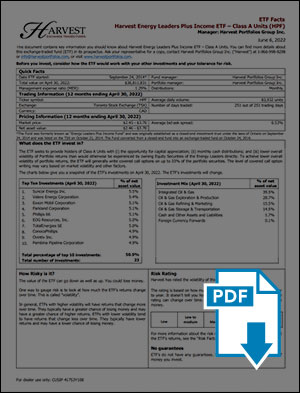
| ETF Facts |
| Document | Language | Type | |
|---|---|---|---|
| Product Sheet | English | French | Fund Documents |
| Investor Brochure | English | - | Fund Documents |
| ETF Facts | English | French | Regulatory |
| Prospectus | English | French | Regulatory |
| ETF Products Booklet | English | French | Information Materials |
| Covered Call Writing | English | French | Information Materials |
| MER Summary | English | French | Information Materials |
| 2024 Quarterly Summary - Q1 | English | - | Portfolio Disclosure |
| 2023 Annual Distributions Summary | English | - | Information Materials |
| 2023 Annual Financial Statements | English | French | Statements/MRFPs |
| 2023 Annual Management Report of Fund Performance | English | French | Statements/MRFPs |
| PFIC Annual Information Statement | English | - | Information Statement |
| Proxy Voting Policy | English | - | Proxy Voting |
| July 1, 2022 to June 30, 2023 Proxy Summary | English | - | Proxy Voting |
HPF Historical Documents (CLICK HERE)
Investment Goal
Harvest Energy Leaders Plus Income ETF is an equally weighted portfolio of 20 large global energy companies. The ETF is designed to provide a consistent monthly income stream with an opportunity for growth. In order to generate an enhanced monthly distribution yield, an active covered call strategy is engaged.
Benefits of investing in HPF
|
 |
Key ETF Details
As at June 28, 2024
| ETF Details | Class A | Class U |
|---|---|---|
| TSX Code | HPF | HPF.U |
| CUSIP | 41753Y108 | 41753Y116 |
| Currency | CAD-Hedged | US Dollar |
| Inception Date | 2014/10/21 | 2014/10/21 |
| Management Style | Active with Covered Calls | |
| Eligible | RRSP | RRIF | RESP | TFSA | FHSA | |
| Management Fee | 0.85% | |
| Risk Rating | ||
| Distribution Facts | Class A | Class U |
| Last Distribution | CA$0.0250 | US$0.0250 |
| Last Record Date | 2024/06/28 | 2024/06/28 |
| Distributions SI* | CA$4.0954 | US$4.0954 |
| Distribution Frequency | Monthly | |
| Distribution Method | Cash or DRIP | |
| Annual Distributions Summary | PDF View | |
Relevant Posts
Episode 17 | Is it time for energy investors to look at large-cap with Mike Dragosits | Harvest Talks
Oil prices have swung extremely…
Energy stocks are strong, how can long-term investors capture this positivity? | HPF
While high crude prices greatly benefit high-beta energy producers…
Harvest Announces Monthly Distribution Increase for Harvest Energy Leaders Plus Income ETF
Harvest Portfolios Group Inc…
Disclaimer
Harvest Energy Leaders Plus Income ETF
Commissions, management fees and expenses all may be associated with investing in Harvest Exchange Traded Funds (managed by Harvest Portfolios Group Inc.). Please read the relevant prospectus before investing.The indicated rates of return are the historical annual compounded total returns (except for figures of one year or less, which are simple total returns) including changes in unit value and reinvestment of all distributions and do not take into account sales, redemption, distribution or optional charges or income taxes payable by any securityholder that would have reduced returns.The funds are not guaranteed, their values change frequently and past performance may not be repeated. Distributions are paid to you in cash. If the Fund earns less than the amount distributed, the difference is a return of capital. If the Fund earns less than the amounts distributed, the difference is a return of capital. Tax investment and all other decisions should be made with guidance from a qualified professional.
The current yield represents an annualized amount that is comprised of 12 unchanged monthly distributions (using the most recent month’s distribution figure multiplied by 12) as a percentage of the closing market price of the Fund. The current yield does not represent historical returns of the ETF but represents the distribution an investor would receive if the most recent distribution stayed the same going forward.
* Represents aggregate AUM of all classes denominated in Canadian dollars.
** Inception Date: Class A is 2014/10/21; Class U is 2014/10/21.
† The first year of Calendar Year Performance presents the rate of return from commencement of operations to December 31 of that year.
‡Source: Bloomberg. Average statistics calculated based on portfolio weighted average. Dividend yield (gross) based on Bloomberg indicated 12 month yield of portfolios positions and does not represent the distribution yield paid to investors. The above information is for illustrative purposes only, is estimated and unaudited.
# For illustrative purposes only. The chart above only shows the market value per unit of Harvest Energy Leaders Plus Income ETF ("HPF") using the daily market close on the TSX and identifies the monthly cash distributions paid by HPF on a cumulative basis. The cash distributions are not compounded or treated as reinvested, and the chart does not take into account sales, redemption, distribution or optional charges or income taxes payable by any unitholder. The chart is not a performance chart and is not indicative of future market values of HPF or returns on investment in HPF, which will vary.


