
By Ambrose O’Callaghan
The S&P 500 has climbed 16.5% in the year-to-date period as of mid-afternoon trading on Thursday, November 4, 2025. Robust corporate earnings have powered the index in the face of mixed economic data. The benchmark’s forward price-to-earnings (P/E) ratio has now climbed to levels well above historical averages. This has ignited an oft-repeated debate – Are these valuations justified, or is the market on the cusp of overheating?
It comes as no surprise that technology is at the centre of this debate. Mega cap technology companies and their associated sectors have led the pack. The share prices of Nvidia, Apple, Amazon, and Microsoft have soared in the year-to-date period. Meanwhile, the AI ecosystem – comprised of data centre operators, software providers, chip manufactures, and more – is drawing renewed attention in this atmosphere.
In this piece, we will look at some of the attributes (economic moats) that make technology such a dominant sector with focus on some of the top companies in this space. After that, we will take a closer look at where the opportunities in artificial intelligence stand in late 2025. lastly, we will cap it off with a look at Harvest’s award winning technology ETF, the Harvest Tech Achievers Growth & Income ETF (TSX: HTA). HTA seeks to generate consistent cash flow while capturing long-term growth opportunities for its unitholders. Let’s jump in.
Technology | Still the most dominant sector
Dominant technology companies like Nvidia, Microsoft, Apple, Alphabet, and Amazon, to name a few, have established powerful moat that have contributed to their impressive competitive advantage. These “technology moats” can protect these companies from rivals, making their technology difficult and/or expensive to replicate. That also allows these companies to charge premium pricing to maintain high profit margins, effectively beat out competitors and newcomers into the space, and re-invest those profits to power further innovation. This final factor serves to deepen their competitive advantages.
Nvidia | Gaming graphics leader turned generative AI powerhouse
In a recent piece, we discussed Nvidia’s rise to prominence in the AI space following the debut of Chat GPT in November 2022. See the chart below shows Nvidia’s stock price increase since then.
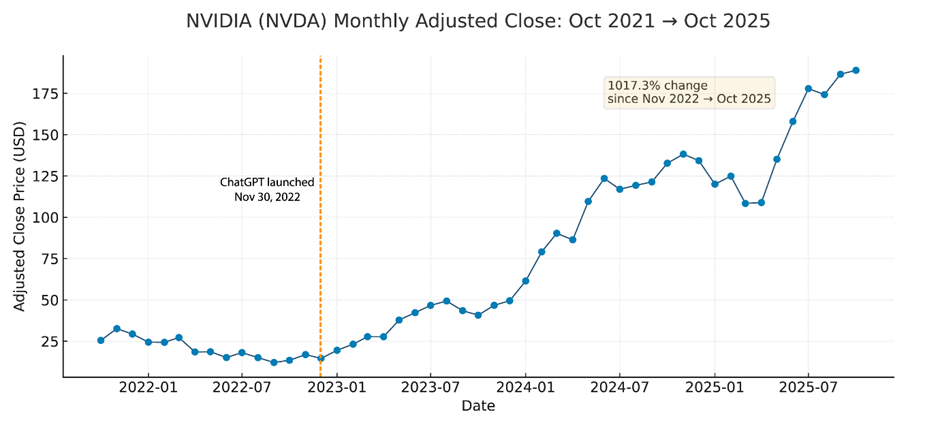
Source: NVIDIA historical monthly adjusted close prices (Oct 2021-Oct 2025) from Digrin, retrieved October 2025. ChatGPT public release date (Nov 30, 2022) from OpenAI’s official announcement.
Nvidia’s technology moat flows from its dominant position in graphics and accelerated computing. This is anchored by its proprietary CUDA platform, which has developed into the industry standard for AI and high-performance computing. Nvidia has strengthened its advantage by integrating its GPUs with software, networking, and AI frameworks. The company has powered ahead in innovation, cementing its position at the core of the global AI boom.
Microsoft | Integrated ecosystem driving enterprise dominance
Microsoft’s technology moat stems from its seamless integration across software, cloud, and enterprise ecosystems. This creates strong lock-in effects for businesses. The company’s dominance in Windows, Office 365, and Azure has provided a unified platform that is essential for its users, and difficult to replace. Microsoft continues to make significant investments in AI, including its OpenAI partnerships and Copilot integration.
Apple | Hardware giant with a die-hard consumer base
Apple’s technology moat is built on its cutting-edge hardware and software offerings. This has created a cohesive and intuitive user experience that competitors cannot easily match.
Apple’s hardware product lineup, which spans the iPhone, Mac, Apple Watch, and software ecosystem, including services like iCloud and Apple Music, keeps its users deeply connected. This has generated strong brand loyalty, making its consumer base much less likely to switch to a competitor.
Alphabet | Digital search and advertising titan
Alphabet’s technology moat draws from its supremacy in digital search and advertising. That is supported by its unmatched access to global data as well as its advanced AI capabilities. The company’s core platforms, including Google Search, YouTube, and Android, have created a self-reinforcing network of users and advertisers. Alphabet has an evolving competitive edge due to its expansion into cloud computing, AI, and emerging technology like Waymo.
Artificial Intelligence | Bubble vs boom
The significant ramp up in AI spending has powered market enthusiasm in recent months. However, it has also woken up critics who are eager to sound the warning bells of an “AI bubble”. While valuations are soaring, AI’s forward development also holds significant promise that is borne out in the data.
AI has been able to advance significantly in recent years in large part due to the success of deep learning. Deep learning systems have been able to improve due to the massive increase in the inputs that have been used to train them. This is especially true in computation.
Before the advent of deep learning at the turn of the 2010s, the computation used to train notable AI systems nearly doubled every two years. The chart below illustrates that the rise of deep learning has greatly accelerated this process. Computation is now doubling every six months.
Training Computation vs. Parameters in Notable AI
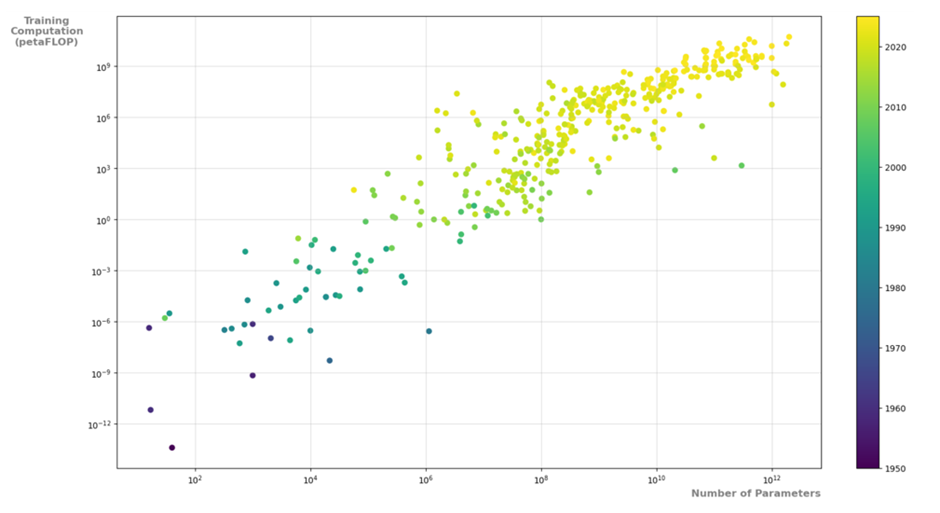
Source: Epoch AI (2025) via Our World in Data, Harvest ETFs, Latest as of September 30, 2025.
It follows that this astronomical increase will require ever-greater hardware and energy costs to train these systems.
Hardware & Energy Cost to Train Notable Systems
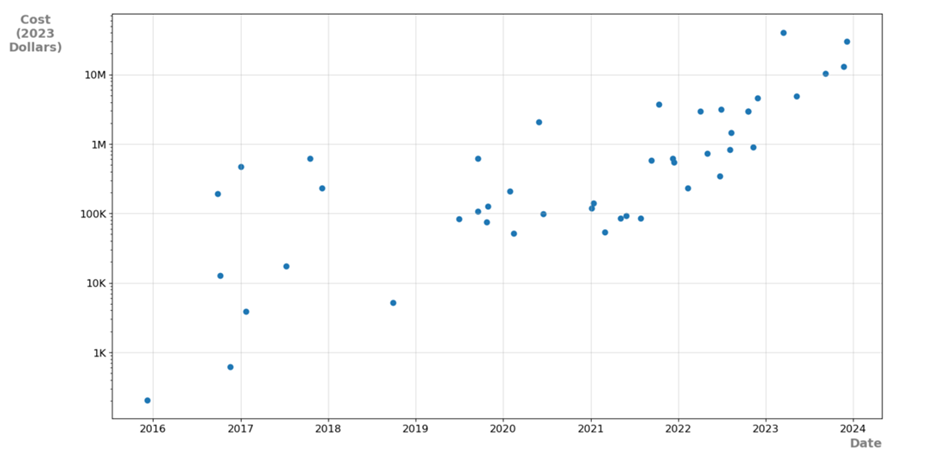
Source: The 2025 AI Index Report, Stanford University. “Select AI Index technical performance benchmarks versus human performance.
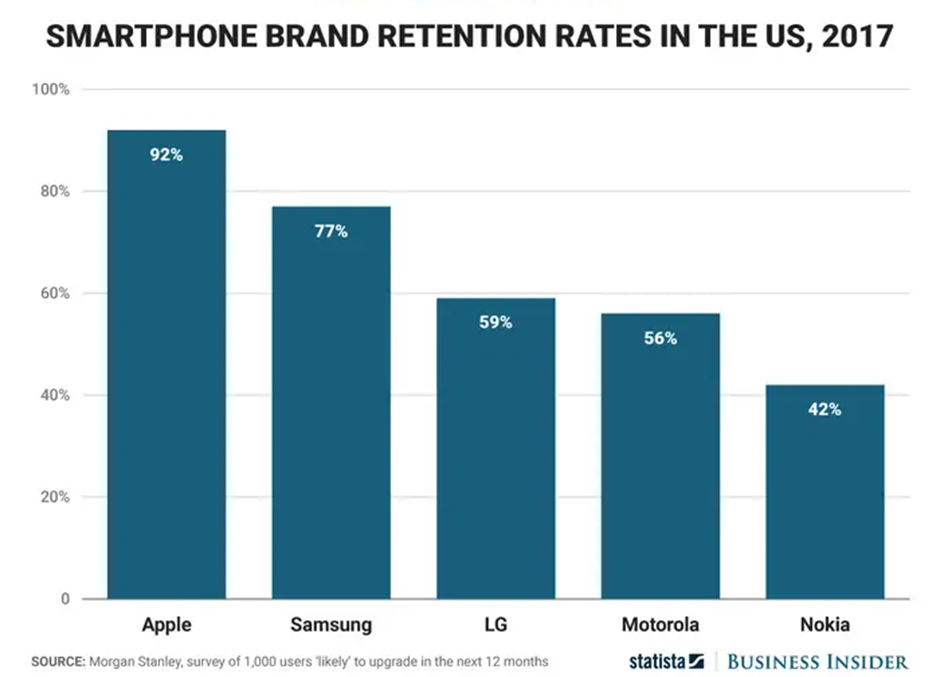
And the products themselves? ChatGPT was the first of the large language models (LLMs) to gain real traction with the public when it launched in November 2022. Since then, its usage among consumers has absolutely skyrocketed. Perhaps even more impressive has been the rates of product retention that has been reported.
The 2025 AI Index Report from Stanford University dove into some of the advances made in this arena so far this decade. In 2023, researchers introduced new benchmarks like MMMU, GPQA, and SWE-bench to test the limits of advanced AI systems. Performance showed impressive jumps in just 12 months.
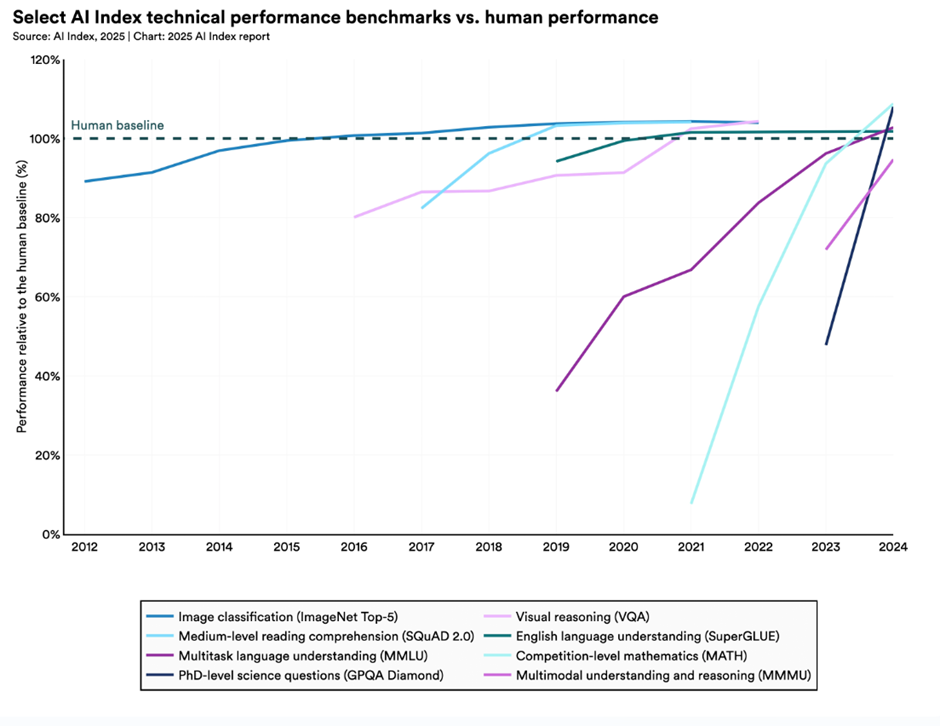
Source: The 2025 AI Index Report, Stanford University. “Select AI Index technical performance benchmarks versus human performance.
Moreover, AI is being used by more people in their everyday lives. This is true across sectors. That said, this has also come with new challenges. In their report on the state of AI, McKinsey revealed that organizational respondents reported increasing the mitigation of issues like inaccuracy, intellectual property infringement, and privacy risks that come with the increased use of generative AI.
Despite those risks, AI usage among professionals continues to grow rapidly, with little signs of slowing up.
Business functions at respondents’ organizations that are using AI, % of respondents
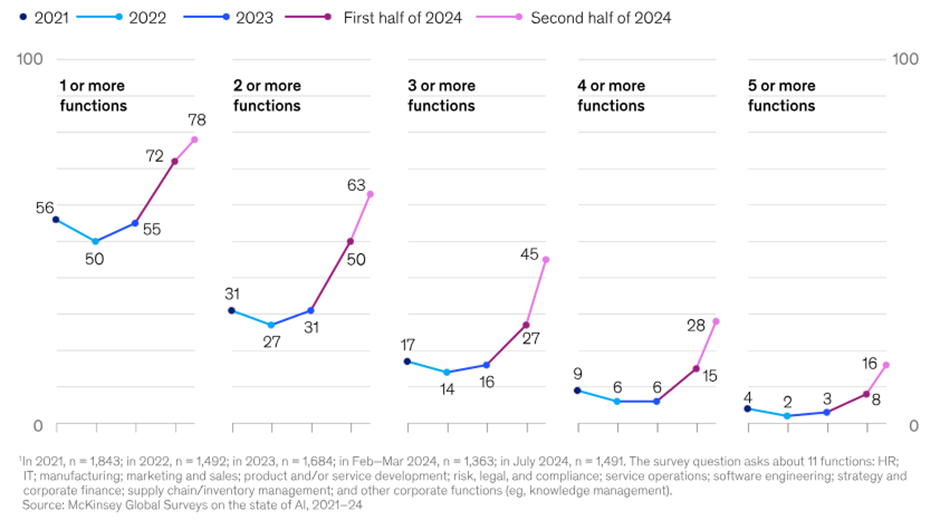
Source: McKinsey Global Surveys on the state of AI, 2021-2024. https://www.mckinsey.com/capabilities/quantumblack/our-insights/the-state-of-ai
HTA & HTAE | Access tech leaders with monthly income
The Harvest Tech Achievers Growth & Income ETF (TSX: HTA)offers access to companies with substantial technology moats, and those that are well-positioned to take advantage of the burgeoning AI space. HTA’s portfolio includes Apple, Alphabet, NVIDIA, and Microsoft. It also provides exposure to other companies that are betting on generative AI, like Meta Platforms, and those facilitating the AI boom through the manufacture of semiconductors, like Broadcom and Applied Materials.
HTA is an equal weighted portfolio of tech companies. The ETF is designed to provide steady monthly cashflows supported by an active covered call option strategy. Indeed, HTA has paid out consistent monthly income since its inception. It has raised its monthly cash distribution five times in its 10-year history. HTA last paid out a monthly distribution of $0.14 per unit, which represents a current yield of 8.74% as at October 31, 2025.
Annual Performance
As at February 28, 2026
Investors who want even more torque on the income and growth side may want to consider the Harvest Tech Achievers Enhanced Income ETF (TSX: HTAE). HTAE applies modest leverage at about 25% to an investment in HTA, aiming to generate higher levels of monthly income and growth potential. The use of leverage is to enhance investment the exposure to underlying ETF. This also serves to amplify gains and losses of the ETF.
HTAE last paid out a monthly cash distribution of $0.16 per unit. That represents a current yield of 10.82% as at October 31, 2025.
Annual Performance
As at February 28, 2026
Disclaimer
The content of this article is meant to provide general information for educational purposes. Any security mentioned herein is for illustration purposes and should not be taken as an invitation to purchase or sell such security.
Commissions, management fees and expenses all may be associated with investing in Harvest Exchange Traded Funds managed by Harvest Portfolios Group Inc. (the “Funds”). The Funds are not guaranteed, their values change frequently, and past performance may not be repeated. Please read the relevant prospectus before investing. Please not that tax investment and all other decisions should be made with guidance from a qualified professional.
The indicated rates of return are the historical annual compounded total returns (except for figures of one year or less, which are simple total returns) including changes in unit value and reinvestment of all distributions and do not take into account sales, redemption, distribution or optional charges or income taxes payable by any securityholder that would have reduced returns.
The Funds pay you distributions in cash unless you request, pursuant to your participation in a distribution reinvestment plan, that they be reinvested into available Class units of the Fund that you own. If the Funds earn less than the amounts distributed, the difference is a return of capital.
Certain statements included in this communication constitute forward-looking statements (“FLS”), including, but not limited to, those identified by the expressions “expect”, “intend”, “will” and similar expressions to the extent they relate to the Fund. The FLS are not historical facts but reflect Harvest’s, the Manager of the Fund, current expectations regarding future results or events. These FLS statements are subject to a number of risks and uncertainties that could cause actual results or events to differ materially from current expectations. Although Harvest, the Manager of the Fund, believes that the assumptions inherent in the FLS are reasonable, FLS are not guarantees of future performance and, accordingly, readers are cautioned not to place undue reliance on such statements due to the inherent uncertainty therein. Harvest, the Manager of the Fund, undertakes no obligation to update publicly or otherwise revise any FLS or information whether as a result of new information, future events or other such factors which affect this information, except as required by law.