By Ambrose O’Callaghan
The Federal Reserve (the “Fed”) was founded on December 23, 1913, as the central banking system of the United States. At the time, the U.S. had contended with a series of financial crises that had rattled the domestic economy. This included the panic of 1907 – a financial crisis that was triggered by the failed attempt in October 1907 to corner the market on the stock of the United Copper Company. These panics led to bank runs, reaffirming the desire of policy makers to have central control of the monetary system.
In this piece, we will review the role of the Fed and how this U.S. central bank chooses its chairperson, presidents, and determines voting power. After that, we will review how these factors could impact rate decisions through 2025 and beyond, and what Harvest ETFs may be impacted by these developments and policy shifts.
The role of the Fed
Upon its founding, the U.S. Congress established three key goals for monetary policy in the Federal Reserve Act. The Fed’s statutory mandate is as follows:
- Maximum Employment
- Stable Prices
- Moderate Long-Term Interest Rates
The Fed has many tools at its disposal to achieve these goals. More traditional monetary policy involves the utilization of open market operations, reserve requirements, and discount window lending.
Traditional monetary policy
Open market operations (OMOs)
Open market operations involve influencing the supply of balances in the federal funds market. In other words, this empowers the central bank to control the supply of money and credit in the economy.
Before the 2007-2008 housing crisis, and the global financial crisis that followed, OMOs were used to adjust the supply of reserve balances. This was done to keep the federal funds rate, which is the interest rate at which depository institutions lend reserve balances to other depository institutions overnight, at or around the target established by the Federal Open Market Committee (FOMC).
This approach evolved significantly in the wake of the 2007-2008 financial crisis and the Great Recession. In 2008, the FOMC established a near-zero target range for the federal funds rate. That move, paired with large-scale asset purchases – which we will cover later – made the Fed a target of scrutiny to a degree not seen since its founding in the early 20th century.
Reserve requirements
The Federal Reserve Act authorizes the Fed board to establish reserve requirements within a specific range. That allows the Fed to effectively implement monetary policy on certain types of deposits and other liabilities of depository institutions. In order to reach the dollar amount of a depository institutions reserve requirement, the Fed applies the reserve requirement ratios to an institutions’ reservable liabilities. After that, the Fed board is authorized to impose reserve requirements on transaction accounts, nonpersonal time of deposits, and Eurocurrency liabilities.
Discount window lending
Another important role of the Fed is discount window lending. The Fed is authorized to lend to depository institutions. Through this, the central bank can support the liquidity and stability of the domestic banking system as well as the effective implementation of monetary policy. The discount window aids depository institutions in the managing of their liquidity risks. This, in turn, helps to avoid actions that could have negative consequences for their customers. Essentially, the discount window supports the flow of credit to households and businesses.
Nontraditional monetary policy
Forward guidance
Central banks around the world use forward guidance to tell the public about the future course of monetary policy. When the Fed provides forward guidance, it allows individuals and businesses to make decisions based on that information. Because of its impact on spending and investment decision making, forward guidance influences financial and economic conditions.
The FOMC began providing forward guidance statements following its meetings in the early 2000s.
Large-scale asset purchases
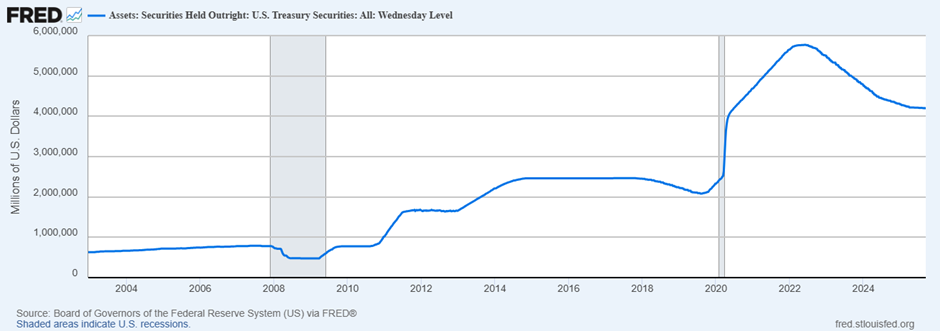
Historically, outright purchases or sales of Treasury securities were used as a tool to manage the supply of bank reserves. This was done to maintain conditions in line with the federal funds target rate.
However, the global financial crisis in 2007-2008 led to dramatic changes in how the Fed approaches large-scale asset purchases. From 2008 to 2014, the FOMC authorized three rounds of large-scale asset purchase programs – also referred to as quantitative easing – as well as a maturity extension program.
The COVID-19 pandemic also presented a significant challenge for policymakers. In March 2020, the Fed launched large-scale asset purchases of U.S. Treasury securities to address the market disruptions at the beginning of the pandemic. Other steps including the launch of market functioning purchases of Treasuries and other securities. These purchases were without precedent. Asset purchases reached nearly $2 trillion of notes and bonds purchased just in 2020.
Fed presidents and voting power
The Fed is run by seven governors that are nominated by the President and confirmed by the Senate. All seven of the governors vote at every FOMC meeting. A full term for Fed governors is 14 years, and one term begins every two years. This occurs on February 1 of even-numbered years. After serving a full term, a member cannot be reappointed, whereas a member who completes an unexpired portion of a term may be reappointed.
However, if a member retires earlier, the President may appoint another governor in the interim. For example, Adriana Kugler recently resigned in August of 2025, as her term was expiring in February 2026. This seat was recently filled by the appointment and senate confirmation of Stephen Miran on September 15, 2025. It is expected he will be re-appointed this February when that term is up for renewal.
There are 12 regional bank presidents. Five of these presidents vote at a time on rotation. All 12 presidents have terms that expire at the same time with the next term expiring this coming February. The process for selecting the regional Presidents is complicated. It includes rolling terms for B and C directors of the regional bank that are intended to represent the public. The class B directors are chosen by the regional banks, and the class C directors are appointed by the Federal Reserve Board of Governors. Then, the regional banks’ Presidential nominee must be approved by the Fed’s board of seven in Washington. Chair Jerome Powell’s term as Chair is up in May of 2026 however, he has until 2028 as a board governor, although not unprecedented to serve their full terms on the board, Chairs have historically resigned from the board following their role as Chair.
While this is complicated, this has shone a spotlight on the Fed and regional banks, especially in the wake of the recent governors’ coming retirement and more so given the controversy surrounding Governor Lisa Cook and her potential dismissal.
With now three of the seven board of governors having been appointed by the current administration, should another board of governor retire, or in the case of Governor Cook be removed for cause, that move could shift voting power of the Fed , raising concerns about political influence in the realm of monetary policy. Even though there are some safeguards that remain, the perception of the Fed’s independence being weakened has the potential to unsettle markets.
Rate expectations in 2025
On Wednesday, September 17, the Fed announced that it voted to lower the target range for the federal funds rate by 0.25%, bringing the benchmark rate to 4.25%. Its decision was motivated by the moderation of economic activity in the first half of 2025, as well as slowing jobs data and the increased unemployment rate. The FOMC reiterated that it was “strongly committed to supporting maximum employment and returning inflation to its 2 percent objective.”
A September 5 report showed that the U.S. economy generated only 22,000 jobs in August. This stoked fears that the administration’s economic policies, including massive import taxes, have contributed to uncertainty in the business world. Meanwhile, the unemployment rate rose to 4.3%, moving higher than the six-month moving average. This indicates a sustained increase in unemployment.
Which Harvest ETFs are being impacted by Fed movements?
The uncertainty around Fed policy has boosted gold, benefitting two ETFs in the Harvest stable.
One of them is the Harvest Global Gold Giants Index ETF (TSX: HGGG), an equally weighted portfolio of the world’s leading and largest gold companies. HGGG tracks the Solactive Global Gold Giants Index TR.
Annual Performance
As at February 28, 2026
| Ticker | 1M | 3M | 6M | YTD | 1Y | 2Y | 3Y | 4Y | 5Y | 6Y | 7Y | SI |
|---|---|---|---|---|---|---|---|---|---|---|---|---|
| HGGG | 23.76 | 38.58 | 95.16 | 33.63 | 211.21 | 133.02 | 68.92 | 45.17 | 36.17 | 31.49 | 29.37 | 29.17 |
We also recently launched a gold variant as part of our Harvest High Income Shares™ ETF lineup: the Harvest Agnico Eagle Enhanced High Income Shares ETF (TSX: AEME). AEME invests all its assets in shares of Agnico Eagle Mines. It overlays covered calls and employs modest leverage at around 25%, aiming to generate high levels of monthly income. The rate expectations phenomenon has pushed long-term yields higher, as investors price in incremental inflation risks and continued Fed uncertainty.
Meanwhile, the shorter-term gyrations of bond prices have been a challenging environment with longer term bond prices fluctuating month over month. Mid-duration bonds have been steadier, despite upward moves in yields in August, they will continue to be data dependent.
The Harvest Premium Yield Treasury ETF (TSX: HPYT) – a portfolio of ETFs which hold longer dated US Treasury bonds that are secured by the US government, employs up to 100% covered call writing to generate a higher yield and maximize monthly cash flow. It remains in the black in the year-to-date period. HPYT last paid out a monthly cash distribution of $0.13 per unit.
Annual Performance
As at February 28, 2026
| Ticker | 1M | 3M | 6M | YTD | 1Y | 2Y | SI |
|---|---|---|---|---|---|---|---|
| HPYT | 3.70 | 1.39 | 5.97 | 3.76 | 2.93 | 2.27 | 2.75 |
| HPYT.B | 3.99 | (0.68) | 6.11 | 3.35 | (1.31) | - | 4.44 |
| HPYT.U | 3.80 | 1.73 | 6.84 | 3.99 | 4.68 | 3.63 | 2.72 |
On the medium-term side, the Harvest Premium Yield 7-10 Year Treasury ETF (TSX: HPYM) – a portfolio of US Treasury ETFs that primary hold US bonds with average maturities of 7-10 years. Like HPYT, it can write up to 100% covered call on these holdings to generate monthly income. HPYM has delivered solid returns in the year-to-date period at the midway point in September 2025. The ETF last paid out a monthly cash distribution of $0.08 per unit.
Annual Performance
As at February 28, 2026
| Ticker | 1M | 3M | 6M | YTD | 1Y | 2Y | SI |
|---|---|---|---|---|---|---|---|
| HPYM | 1.76 | 0.88 | 3.01 | 1.55 | 5.42 | 4.06 | 2.86 |
| HPYM.U | 1.85 | 1.32 | 3.84 | 1.77 | 7.22 | 5.54 | 4.22 |
Investors should circle their calendars for Wednesday, September 17th. That day will see both the Federal Reserve and the Bank of Canada hold their interest rate announcements following key meetings. We are likely to see movements across the markets around headlines as we await additional jobs and inflation data later in the month. Margins will be our key focus in the third quarter.
Disclaimer
The content of this article is to inform and educate and therefore should not be taken as investment, tax, or financial advice. Commissions, management fees and expenses all may be associated with investing in Harvest Exchange Traded Funds (managed by Harvest Portfolios Group Inc.). Please read the relevant prospectus before investing. The funds are not guaranteed, their values change frequently, and past performance may not be repeated. The content of this article is to inform and educate and therefore should not be taken as investment, tax, or financial advice.
Certain statements included in this communication constitute forward-looking statements (“FLS”), including, but not limited to, those identified by the expressions “expect”, “intend”, “will” and similar expressions to the extent they relate to the Fund. The FLS are not historical facts but reflect Harvest’s, the Manager of the Fund, current expectations regarding future results or events. These FLS statements are subject to a number of risks and uncertainties that could cause actual results or events to differ materially from current expectations. Although Harvest, the Manager of the Fund, believes that the assumptions inherent in the FLS are reasonable, FLS are not guarantees of future performance and, accordingly, readers are cautioned not to place undue reliance on such statements due to the inherent uncertainty therein. Harvest, the Manager of the Fund, undertakes no obligation to update publicly or otherwise revise any FLS or information whether as a result of new information, future events or other such factors which affect this information, except as required by law.