By Ambrose O’Callaghan
The United States stock market has roiled off all-time highs in the early part of this summer. This is particularly impressive given the turbulence the market experienced in the middle of the spring season. It has not been a straight shot up for every sector. Different parts of the market have taken turns leading the pack. Those market rotations started in April and have continued into the summer heat. Today, we will highlight two sectors of note that have performed strongly – technology and industrials – and look at an ETF that provides diversified exposure to equities that represent the biggest brands on the planet.
Technology takes the lead again
In June the technology sector regained the lead in powering the market’s growth. As at July 17, 2025, the S&P Technology Index climbed 10.85% in the year-to-date period. In an earlier article that highlighted the momentum in the technology sector, we identified the following subsectors that’s worth investors’ attention:
- Semiconductors
- Artificial Intelligence
- Software
- Cryptocurrency and Blockchain
- Quantum
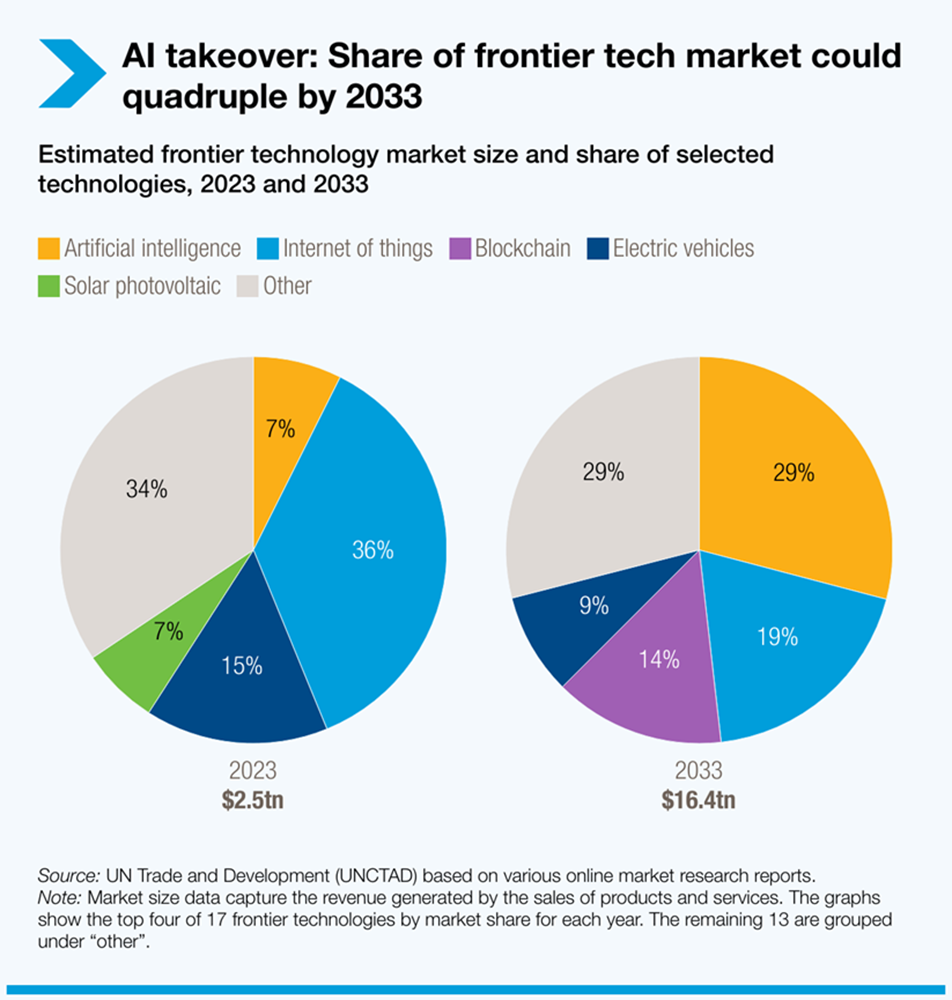
Sub-sectors like AI and software are already generating significant revenues for big technology names. Meanwhile, a sub-sector like quantum remains in the early stages of development but is worth targeting as an area of substantial potential.
The Harvest Tech Achievers Growth & Income ETF (HTA:TSX) provides access to large-cap tech companies that are leaders in the tech sector, that’s currently powering the overall market’s growth. HTA boasts holdings that are leaders in the following sub-sectors:
- Software | Microsoft, Oracle, Salesforce, etc.
- Semiconductors | Broadcom, Micron Technology, Applied Materials
- Artificial Intelligence | Meta Platforms, Alphabet, NVIDIA
HTA is overlayed with an active covered call writing strategy to support its monthly cash distributions. It last paid $0.14 per unit in distribution. Since its inception in 2015, HTA has raised its monthly distribution five times.
Annual Performance
As at March 31, 2026
| Ticker | 1M | 3M | 6M | YTD | 1Y | 2Y | 3Y | 4Y | 5Y | 7Y | 8Y | 10Y | SI |
|---|---|---|---|---|---|---|---|---|---|---|---|---|---|
| HTA | (3.93) | (8.50) | (7.10) | (8.50) | 14.28 | 6.08 | 17.21 | 10.50 | 11.90 | 15.86 | 15.19 | 16.36 | 14.18 |
| HTA.B | (1.85) | (6.79) | (6.12) | (6.79) | 12.72 | 9.30 | 19.94 | 15.01 | 15.50 | - | - | - | 18.90 |
| HTA.U | (3.76) | (8.03) | (6.08) | (8.03) | 16.61 | 7.86 | 18.79 | 11.98 | 13.18 | 17.38 | 16.63 | - | 17.08 |
The Harvest Tech Achievers Enhanced Income ETF (HTAE:TSX) offers a “higher-torque” option: it is built to deliver enhanced cashflows and growth opportunities. It applies modest leverage of approximately 25% to an investment in HTA. It last paid out a monthly distribution of $0.16 per unit.
Annual Performance
As at March 31, 2026
Trends to watch for industrials
The broader market has also benefited from rotations into the industrials space. Indeed, the S&P Industrials Index has climbed 15% in the year-to-date period as of early morning trading on July 18, 2025. It has increased nearly 20% in the year-over-year period at the time of this writing.
In late June, we explored the ongoing trends in the American manufacturing space. The industrials sector stands to benefit from an economic transformation that our team has characterized as the three “Rs”:
Recovery | U.S. Manufacturing
Three key pieces of legislation during the Biden administration laid the groundwork for the revitalization of America’s infrastructure and energy/utilities sectors. Holdings within HIND including names like Caterpillar and Canadian Pacific Kansas City Limited are well-positioned to benefit from the massive spending it will take to bring this to fruition.
Rebuild | Infrastructure Investment
Industrials are positioned to benefit from few bipartisan consensuses that still exist in the U.S., and a commitment to increased infrastructure spending is one of them. A belief in maintaining America’s global advantage in all matters military is another. HIND holdings like Lockheed Martin and RTX Corporation should continue to benefit from heightened defence spending going forward.
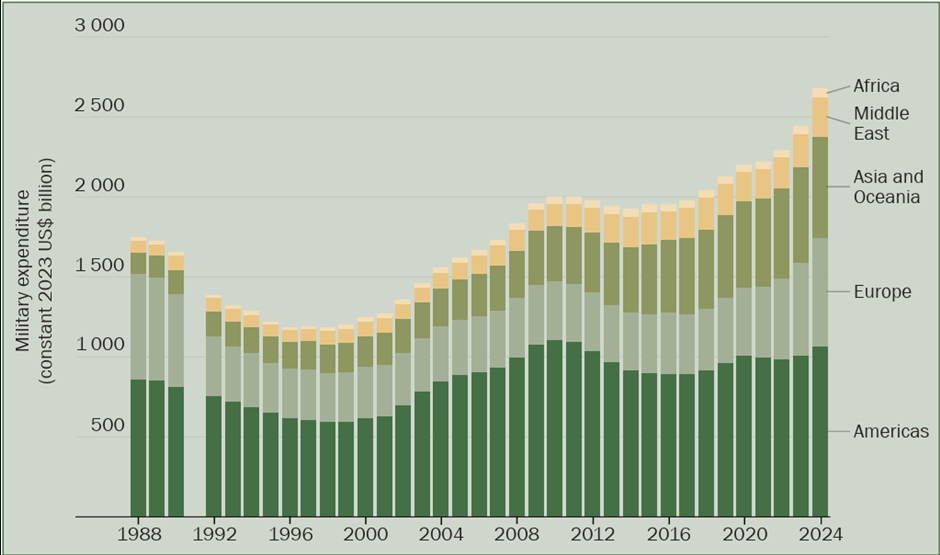
Source: Stockholm International Peace Research Institute, 2024.
Repatriation | American Advantage
The U.S. has sought to revamp US chip manufacturing in the 2020s. A Deloitte report recently projected that the semiconductor industry could reach $2 trillion by 2040 on the back of soaring demand due to the rise of generative AI. HIND holdings like AMETEK and Eaton Corporation have a strong presence in the semiconductor manufacturing space.
What is HIND? The Harvest Industrial Leaders Income ETF (HIND:TSX) is a diversified portfolio of leading industry companies from various sub-sectors across Industrials. It uses an active covered call writing strategy to generate monthly income. Investors can use HIND to get access to the growth potential of leading industrial stocks while getting monthly cash distributions.
Annual Performance
As at March 31, 2026
| Ticker | 1M | 3M | 6M | YTD | 1Y | SI |
|---|---|---|---|---|---|---|
| HIND | (6.31) | 5.47 | 6.23 | 5.47 | 18.46 | 10.00 |
The enduring power of brands
What makes a lasting and successful brand? A globally recognized brand is typically characterized by a concrete identity, one that often provokes an emotional connection among the general audience and its consumers. The S&P 500 contains the 500 largest constituents in the United States. It has climbed 7% in the year-to-date period as of close on July 18, 2025. The index is up 12% in the year-over-year period.
The strength of global brands
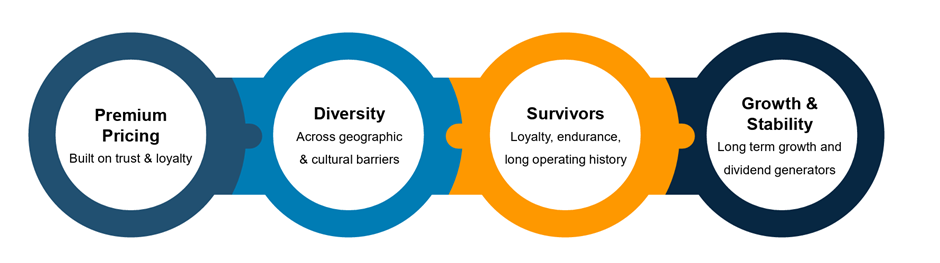
Earlier this month, we’d examine how the Harvest Brand Leaders Plus Income ETF (HBF:TSX) focuses on three crucial elements that provide value to its unitholders: Quality, Growth, and Income.
HBF targets companies that have built and maintained a reputation of consistent quality. That includes dividend kings like Procter & Gamble, The Coca-Cola Company, PepsiCo, and Walmart. HBF also offers exposure to companies that are well-positioned to benefit from growth trends. That includes Alphabet and the AI revolution, and JPMorgan and the expansion of digital banking. To generate consistent income, HBF uses an active covered call writing strategy. It last paid out a monthly cash distribution of $0.0650 per unit.
Annual Performance
As at March 31, 2026
| Ticker | 1M | 3M | 6M | YTD | 1Y | 2Y | 3Y | 4Y | 5Y | 7Y | 8Y | 10Y | 11Y | SI |
|---|---|---|---|---|---|---|---|---|---|---|---|---|---|---|
| HBF | (3.06) | (3.81) | (0.23) | (3.81) | 12.60 | 10.15 | 10.16 | 5.32 | 6.21 | 9.02 | 8.84 | 9.66 | 8.97 | 8.28 |
| HBF.B | (0.98) | (2.08) | 0.74 | (2.08) | 11.06 | 13.35 | 12.66 | 9.46 | 9.48 | - | - | - | - | 12.26 |
| HBF.U | (2.90) | (3.39) | 0.78 | (3.39) | 14.89 | 11.85 | 11.58 | 6.57 | 7.28 | 10.29 | 10.06 | 10.77 | 10.15 | 9.36 |
Disclaimer
Commissions, management fees and expenses all may be associated with investing in Harvest Exchange Traded Funds (managed by Harvest Portfolios Group Inc.). Please read the relevant prospectus before investing. The indicated rates of return are the historical annual compounded total returns (except for figures of one year or less, which are simple total returns) including changes in unit value and reinvestment of all distributions and do not take into account sales, redemption, distribution or optional charges or income taxes payable by any securityholder that would have reduced returns. The funds are not guaranteed, their values change frequently, and past performance may not be repeated. Tax investment and all other decisions should be made with guidance from a qualified professional.
Certain statements included in this communication constitute forward-looking statements (“FLS”), including, but not limited to, those identified by the expressions “expect”, “intend”, “will” and similar expressions to the extent they relate to the Fund. The FLS are not historical facts but reflect Harvest’s, the Manager of the Fund, current expectations regarding future results or events. These FLS statements are subject to a number of risks and uncertainties that could cause actual results or events to differ materially from current expectations. Although Harvest, the Manager of the Fund, believes that the assumptions inherent in the FLS are reasonable, FLS are not guarantees of future performance and, accordingly, readers are cautioned not to place undue reliance on such statements due to the inherent uncertainty therein. Harvest, the Manager of the Fund, undertakes no obligation to update publicly or otherwise revise any FLS or information whether as a result of new information, future events or other such factors which affect this information, except as required by law.