By Ambrose O’Callaghan
In late January, technology stocks were rattled after the emergence of DeepSeek. The Chinese artificial intelligence model showed capabilities that rivalled, and in some cases surpassed, those shown by some of the more sophisticated generative AI models developed in the United States, including ChatGPT from OpenAI. The Chinese startup claims that its AI assistant uses less data at a fraction of the cost of its competitors.
Where does the AI race stand now? Should investors be shifting their strategy in response to China’s so-called “Sputnik” AI moment? Let’s dive in.
What are the implications for NVIDIA and other top tech stocks?
NVIDIA, which has seen its market cap erupt in recent years, suffered a dip as a reaction to the news. Other chipmakers like Broadcom and ChatGPT backer Microsoft also suffered retreats.
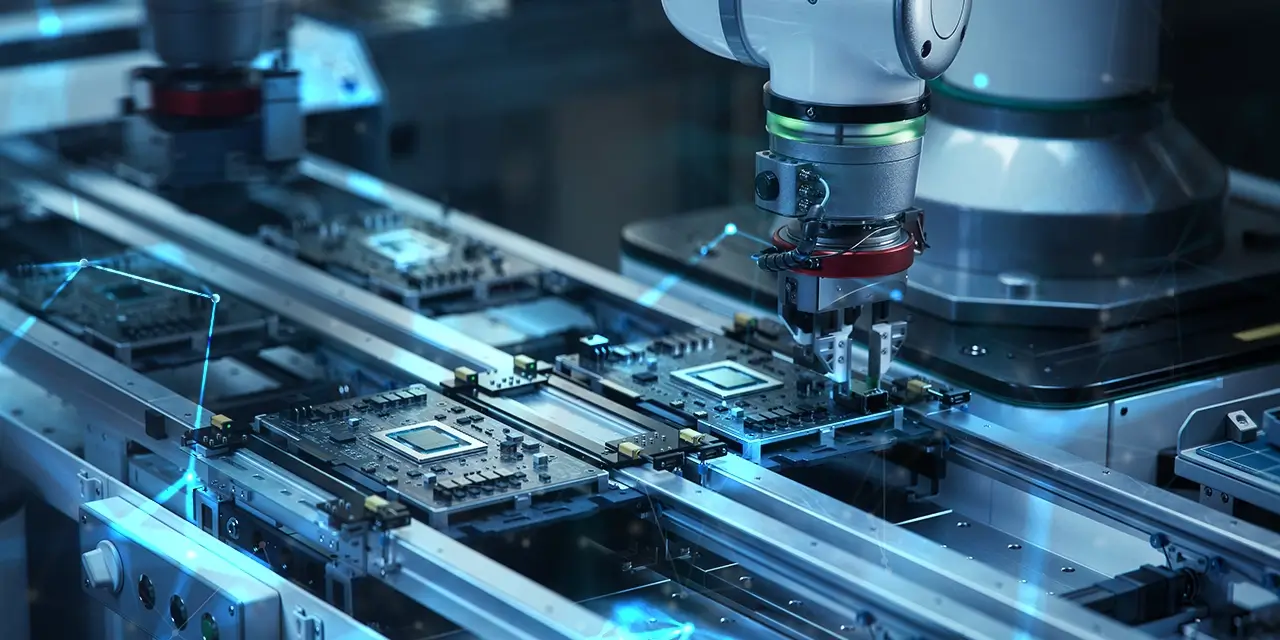
Generative AI refers to artificial intelligence that uses generative models to produce text, images, videos, or other forms of media. The launch of ChatGPT to the public in November 2022 thrust these models into the mainstream. These AI applications are highly complex and require parallel processing of multiple calculations. Central processing units (CPUs) are built to process instructions that quickly solve problems sequentially. Meanwhile, graphics processing units (GPUs) are more effective for tasks that benefit from parallel computing.
NVIDIA’s industry-leading GPUs were primarily used in the video game arena. However, the rise of generative AI was a game-changer for the company. NVIDIA’s market cap has ballooned to over $3 trillion in a relatively short period of time.
DeepSeek’s model was built on less sophisticated CPUs and with reportedly less expenditure than its Western counterparts. Jensen Huang, NVIDIA’s chief executive officer (CEO), recently said that investors misunderstood the significance of DeepSeek’s AI advancements. He pointed to the still-strong demand for AI computing. Moreover, he pointed to post-training AI models, which requires significant processing capability and will sustain demand for NVIDIA’s processors.
How could DeepSeek’s breakthrough impact other sectors?
In a prior piece, we’d discussed how the rise of generative AI could have an outsized impact on the utilities space due to its effect on power demand. Research from SemiAnalysis showed that ChatGPT queries were 6-10 times more power intensive than standard Google searches.
Source: SemiAnalysis.
Increased generative AI use was projected to drive a huge increase in data center power demand going forward. However, DeepSeek’s ability to utilize far less energy appeared to cast that projection into doubt. After a month of working with DeepSeek, new findings have cast that assumption into serious question.
New numbers that were shared with MIT Technology Reviewshowed that this claim was misleading. “Early figures – based on the performance of one of DeepSeek’s smaller models on a small number of prompts – suggest it could be more energy intensive when generating responses than the equivalent-size model from Meta.” To summarize: DeepSeek may save energy in the training stage for the model, but that is eventually offset by the more intensive techniques it employs for answering queries.
The shift in how models are training could have an impact on energy use over the long term. However, industry experts still expect that post-training usage will fuel increased power demand through the 2020s.
Which Harvest ETFs provide access to these areas?
The Harvest Tech Achievers Growth & Income ETF (HTA:TSX)is an equally-weighted portfolio of 20 large-cap technology companies that is diversified across global technology sectors. This portfolio currently includes chipmakers like NVIDIA and Broadcom, as well as companies that are investing billions in developing generative AI like Meta, Alphabet, and Microsoft.
HTA is designed to provide a consistent and competitive monthly income with an opportunity for growth. It last paid out a monthly cash distribution of $0.14 per unit.
Annualized Performance
As at May 31, 2025
| Ticker | 1M | 3M | 6M | YTD | 1Y | 2Y | 3Y | 4Y | 5Y | 7Y | 8Y | 10Y | SI |
|---|---|---|---|---|---|---|---|---|---|---|---|---|---|
| HTA | 7.77 | (1.64) | (5.60) | (3.86) | 7.16 | 17.90 | 16.37 | 11.65 | 17.12 | 15.36 | 16.50 | 14.65 | 14.68 |
| HTA.B | 7.38 | (6.14) | (6.48) | (7.38) | 9.60 | 19.90 | 20.95 | 16.39 | 18.21 | - | - | - | 19.97 |
| HTA.U | 7.87 | (1.05) | (4.58) | (2.99) | 8.85 | 19.25 | 17.70 | 12.72 | 18.29 | 16.74 | - | - | 17.78 |
For investors aiming for even higher levels of income, there is the Harvest Tech Achievers Enhanced Income ETF (HTAE:TSX). This ETF applies modest leverage of approximately 25% to an investment in HTA. It last paid out a monthly cash distribution of $0.16 per unit.
Annualized Performance
As at May 31, 2025
The utilities space is still positioned to benefit from the rise in power demand that will come from the widespread adoption and usage of generative AI models. The Harvest Equal Weight Global Utilities Income ETF (HUTL:TSX) provides access to a diversified portfolio of global utilities companies. That includes more than a quarter of the portfolio invested in electric utilities at the time of this writing. This portfolio is overlaid with an active covered call writing strategy to generate high monthly cash distributions and reduce volatility. It last paid out a monthly cash distribution of $0.1216 per unit.
Annualized Performance
As at May 31, 2025
| Ticker | 1M | 3M | 6M | YTD | 1Y | 2Y | 3Y | 4Y | 5Y | 6Y | SI |
|---|---|---|---|---|---|---|---|---|---|---|---|
| HUTL | 1.67 | 3.78 | 5.32 | 9.99 | 18.31 | 12.71 | 5.25 | 6.92 | 8.15 | 5.69 | 6.26 |
Investors who want higher income can target the Harvest Equal Weight Global Utilities Enhanced Income ETF (HUTE:TSX). This ETF applies modest leverage to an investment in HUTL. It last paid out a monthly cash distribution of $0.0880 per unit.
Annualized Performance
As at May 31, 2025
Disclaimer:
Commissions, management fees and expenses all may be associated with investing in Harvest ETFs managed by Harvest Portfolios Group Inc. (the “Funds” or a “Fund”). Please read the relevant prospectus before investing. The Funds’ returns are not guaranteed, their values change frequently, and past performance may not be repeated. The content of the article is to inform and educate. Tax investment and all other decisions should be made with guidance from a qualified professional. The indicated rates of return are the historical annual compounded total returns (except for figures of one year or less, which are simple total returns) including changes in unit value and reinvestment of all distributions and do not take into account sales, redemption, distribution or optional charges or income taxes payable by any securityholder that would have reduced returns.


