
By Ambrose O’Callaghan
As January 2026 ended, Harvest ETFs reinforced its long-standing commitment to income investors by announcing distribution increases across 10 Harvest Income ETFs.
This milestone reflects a disciplined focus on delivering consistent, growing cash flow through market cycles. To date, Harvest Income ETFs have paid more than $2 billion in cumulative distributions to unitholders. This achievement is built on experience, portfolio construction discipline, and active income strategies designed for long-term outcomes.
HTA | Steady monthly income with access to tech titans
Technology has been the standout on the S&P 500 over the past several years. The Harvest Tech Achievers Growth & Income ETF (TSX: HTA), which offers exposure to large-cap technology companies, has enjoyed a strong run over the past three years on the back of this momentum.
Annual Performance
As at January 31, 2026
| Ticker | 1M | 3M | 6M | YTD | 1Y | 2Y | 3Y | 4Y | 5Y | 7Y | 8Y | 10Y | SI |
|---|---|---|---|---|---|---|---|---|---|---|---|---|---|
| HTA | 0.39 | (1.41) | 7.04 | 0.39 | 10.91 | 15.55 | 24.71 | 12.27 | 15.65 | 18.85 | 16.21 | 18.31 | 15.42 |
| HTA.B | (0.23) | (3.71) | 6.31 | (0.23) | 6.14 | 18.05 | 27.24 | 15.74 | 18.41 | - | - | - | 20.87 |
| HTA.U | 0.57 | (0.81) | 8.18 | 0.57 | 13.30 | 17.31 | 26.27 | 13.76 | 16.94 | 20.36 | 17.59 | - | 18.67 |
HTA recently increased its monthly cash distribution to $0.16 per unit. This represented the sixth distribution hike since HTA’s inception in May 2015.
The Harvest Tech Achievers Enhanced Income ETF (TSX: HTAE) offers exposure to the same portfolio of tech giants. However, HTAE applies moderate leverage at approximately 25% to bolster monthly income and growth potential. HTAE hiked its monthly cash distribution to $0.175 per unit.
Annual Performance
As at January 31, 2026
HBF | The world’s biggest brands plus high distributions
The world’s premier brands resonate for their unique combination of quality, consistency, and reliability. These are traits which translate in the investing space and in the equities that represent these companies. Brand power provides resilience in uncertain economic environments, while the size and scale of these companies also allow them to adapt to changing conditions. For investors, that means dividends and share prices are able to deliver consistent growth over time, offering rising income and capital appreciation.
The Harvest Brand Leaders Plus Income ETF (TSX: HBF) is an equal-weighted portfolio of 20 large companies selected from the world’s top 100 brands. It is designed to provide steady monthly income with an opportunity for growth. Some of the biggest brands investors get exposure to include The Coca-Cola Company, Apple, McDonald’s, Walmart, and others.
HBF increased its monthly cash distribution to $0.075 per unit. That now represents a current yield of 8.40% as at February 11, 2026.
Annual Performance
As at January 31, 2026
| Ticker | 1M | 3M | 6M | YTD | 1Y | 2Y | 3Y | 4Y | 5Y | 7Y | 8Y | 10Y | 11Y | SI |
|---|---|---|---|---|---|---|---|---|---|---|---|---|---|---|
| HBF | 0.01 | 0.56 | 9.79 | 0.01 | 11.81 | 14.07 | 11.46 | 5.93 | 8.95 | 10.52 | 8.69 | 10.46 | 9.65 | 8.77 |
| HBF.B | (0.64) | (1.81) | 8.99 | (0.64) | 6.80 | 16.44 | 13.68 | 9.04 | 11.39 | - | - | - | - | 12.90 |
| HBF.U | 0.16 | 1.14 | 10.91 | 0.16 | 14.00 | 15.71 | 12.81 | 7.18 | 10.00 | 11.77 | 9.86 | 11.63 | 10.80 | 9.84 |
HUTL | Defence and income from global utilities
Utilities have long been sought after in portfolios by investors that seek stability, income, and defensive positioning. However, new developments like technological transformations, policy shifts, and the global energy transition have made utilities a surprising source of long-term growth. Because of this, utilities can add an attractive blend of defence and growth orientation to a present-day portfolio.
The Harvest Equal Weight Global Utilities Income ETF (TSX: HUTL) is designed for investors who are looking for defensive positioning with attractive monthly income. HUTL invests in an equal-weighted portfolio of 30 global utilities companies. That global exposure is key. The rise of generative AI is driving global utilities demand, and US and European utilities companies are uniquely positioned for growth in this climate.
See the chart below, which shows the comparative generating capacity across the USA and globally.
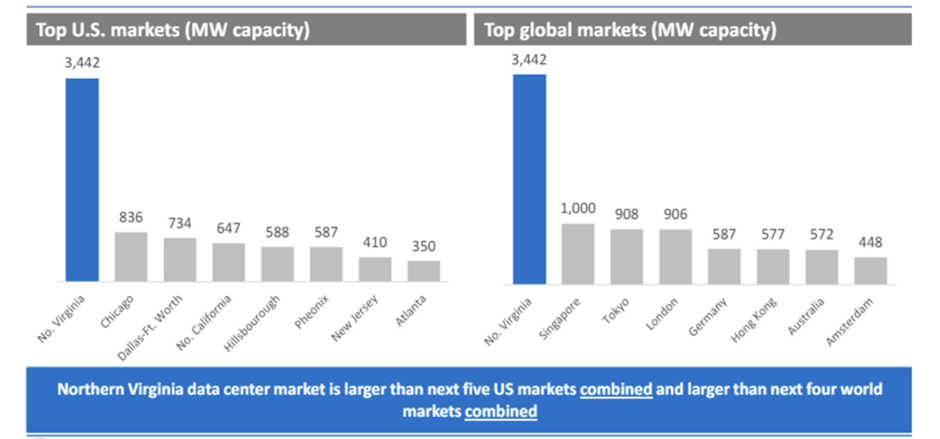
Source: JLL Data Centers 2023 Global Outlook
HUTL recently increased its monthly cash distribution to $0.13 per unit. That represents a current yield of 7.79% as at February 11, 2026.
Annual Performance
As at January 31, 2026
| Ticker | 1M | 3M | 6M | YTD | 1Y | 2Y | 3Y | 4Y | 5Y | 6Y | 7Y | SI |
|---|---|---|---|---|---|---|---|---|---|---|---|---|
| HUTL | 4.37 | 4.59 | 7.59 | 4.37 | 19.18 | 18.02 | 11.22 | 7.47 | 9.47 | 5.24 | 6.88 | 7.09 |
For investors who want even higher levels of monthly income and growth potential, there is the Harvest Equal Weight Global Utilities Enhanced Income ETF (TSX: HUTE). This ETF applies modest leverage to an investment in HUTL, enhancing monthly income and potential growth exposure. HUTE recently increased its monthly cash distribution to $0.095 per unit. That represents a current yield of 9.39% as at February 11, 2026.
Annual Performance
As at January 31, 2026
HLIF | Access Canada’s bull run with high monthly income
In late 2025, we highlighted Harvest’s core Canadian ETFs. While the US-Canada trade war has shaken the domestic front, the Canadian stock market has boomed. Meanwhile, the Liberal government’s new budget – Building Canada Strong – aims to bolster growth through large investments in clean energy, critical minerals, housing construction, artificial intelligence, and more.
The Harvest Canadian Equity Income Leaders ETF (TSX: HLIF) is focused on a productive segment of the Canadian equity market: Blue-chip dividend payers. This includes quality companies with long histories of dividend-growth, including dividend kings (50+ years of dividend growth) like Canadian Utilities Ltd and Fortis Inc, and companies with 30+ years of dividend increases like Enbridge. By combining Harvest’s proven option writing approach with HLIF’s portfolio of consistent dividend payers, the ETF can generate enhanced cashflow.
Enhanced Cashflow from Dividends and Covered Call Strategy
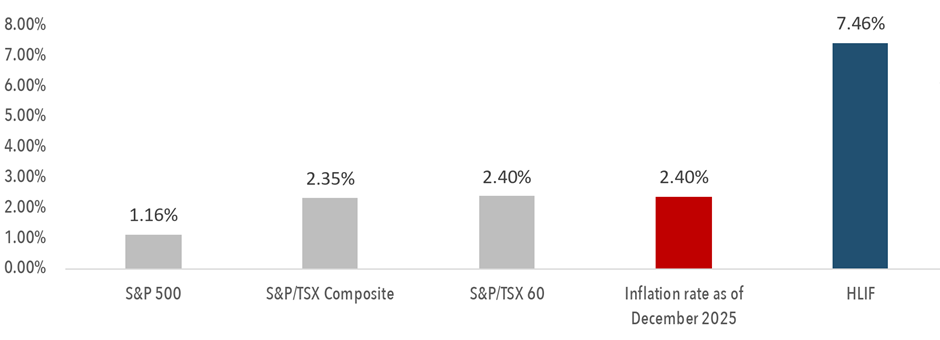
Sources: Bloomberg, Harvest Portfolios Group Inc.,; Inflation based on StatsCan year over year CPI.
Source: Bloomberg, January 30, 2026.
HLIF recently increased its monthly cash distribution to $0.07 per unit. That represents a current yield of 7.24% as at February 11, 2026.
Annual Performance
As at January 31, 2026
| Ticker | 1M | 3M | 6M | YTD | 1Y | 2Y | 3Y | SI |
|---|---|---|---|---|---|---|---|---|
| HLIF | 2.03 | 7.64 | 15.93 | 2.03 | 27.46 | 22.09 | 14.30 | 11.25 |
HDIF | Harvest Income ETFs diversified: An all-in-one approach
The Harvest Diversified Monthly Income ETF (TSX: HDIF) holds a portfolio primarily of Harvest equity income ETFs. This includes ETFs that we have covered today – HTA, HBF, HUTL, and HLIF. HDIF employs modest leverage to enhance income and growth potential.
This ETF recently increased its monthly cash distribution to $0.09 per unit. That represents a current yield of 12.00% as at February 11, 2026.
Annual Performance
As at January 31, 2026
| Symbol | 1M | 3M | 6M | YTD | 1Y | 2Y | 3Y | SI | |
|---|---|---|---|---|---|---|---|---|---|
| HDIF | 0.46 | 3.78 | 10.63 | 0.46 | 11.71 | 16.62 | 13.33 | 7.60 |
Summary
Harvest continues to focus on building core, consistent, and growing income strategies designed to support long-term investor goals. With more than $2.4 billion in cumulative distributions paid, Harvest Income ETFs remain a cornerstone for investors seeking dependable cash flow.
Investors can track upcoming payments using the Harvest ETF Distribution Schedule 2026, a clear and easy-to-read guide outlining key distribution dates for the year ahead.
Disclaimer
Commissions, management fees and expenses all may be associated with investing in Harvest Exchange Traded Funds managed by Harvest Portfolios Group Inc. (the “Funds”). Please read the relevant prospectus before investing. The Funds are not guaranteed, their values change frequently, and past performance may not be repeated. Distributions are paid to you in cash unless you request, pursuant to your participation in a distribution reinvestment plan, that they be reinvested into available Class units of the Fund you own. If a Fund earns less than the amounts distributed, the difference is a return of capital.
The indicated rates of return are the historical annual compounded total returns (except for figures of one year or less, which are simple total returns) including changes in unit value and reinvestment of all distributions and do not take into account sales, redemption, distribution or optional charges or income taxes payable by any securityholder that would have reduced returns.
The current yield represents an annualized amount that is comprised of 12 unchanged monthly distributions (using the most recent month’s distribution figure multiplied by 12) as a percentage of the closing market price of the Fund. The current yield does not represent historical returns of the Fund.