By Ambrose O’Callaghan
Moody’s downgraded the United States credit rating on Friday, May 16, 2025. The over century-old agency had maintained the highest credit rating possible for U.S. sovereign debt in opposition with its rivals. However, that holdout finally ended as the agency cited the growing burden of financing the federal government’s budget deficit. It also pointed to the rising cost of rolling over existing debt amid high interest rates.
Since our last Fixed Income piece, which followed Fed rate cuts in December 2024, the Federal Reserve has kept interest rates on hold. The overnight rate currently sits at 4.5%. We also provided a look at the state of the yield curve, as well as our intermediate US Treasury ETF – HYPM, in March.
The rise of the tariff narrative in 2025
President Donald Trump has roiled markets with a blitz of Executive Orders, press conferences, and social media diatribes. However, it is the US President’s aggressive trade policy that has fomented uncertainty and volatility in the market.
Bloomberg Global Trade Policy Uncertainty Index
In April, markets reacted with hostility to the “Liberation Day” tariffs. The administration performed an about-face, and announced a 90-day pause. That led to a reversal for equity markets, bringing us back to a baseline. Still, there is a lot riding on the results of trade negotiations and whether tariffs will need to go higher if the US administration does not get what it wants.
The spectre of stagflation and the yield curve
The 2022/2023 interest rate tightening cycle put pressure on bond and equity markets. Inflation did appear to be under control before the Federal Reserve again began cutting in late 2024. Yields were also falling until the GOP election win, which gave rise to the tariff narrative. With that, inflation has become a worry again. Worse, the spectre of stagflation is looming.
Stagflation refers to the combination of slow growth, high unemployment, and rising prices in an economy. This phenomenon was thought to be only a short-term possibility. However, the long-term stagflation that emerged during the 1970s oil crisis showed that this was an incorrect assumption.
In April 2025, Federal Reserve Chair Jerome Powell warned that tariffs introduced by the new administration were “significantly larger than expected” and could include “higher inflation and slower growth.” In May 2025, JPMorgan CEO Jamie Dimon also threw in a warning. “There’s a chance that [we’ll] have stagflation [in the US],” Dimon told Bloomberg in a recent interview.
Economic data still looks quite good at this stage, but certain sentiment and regional manufacturing indicators point to some potential issues. These risks will remain heightened as the severity of tariff policy is unknown. Fortunately, the administration has shown signs of dialing back on the unsustainable tariffs on China and their European allies. There is still hope for trade negotiations, but when it comes to ramping up inflation and hurting sentiment the damage has already been done.
20-year government bond yields in the U.S. were trading closer to 4.5% just a few months ago. However, the passing of the “Liberation Day” tariffs and now the introduction of the “One Big Beautiful Bill Act”, which is expected could expand the deficit by trillions of dollars, have brought yields closer to 5.0%. That is likely due to both inflationary fears and the risk premium being demanded over the long term.
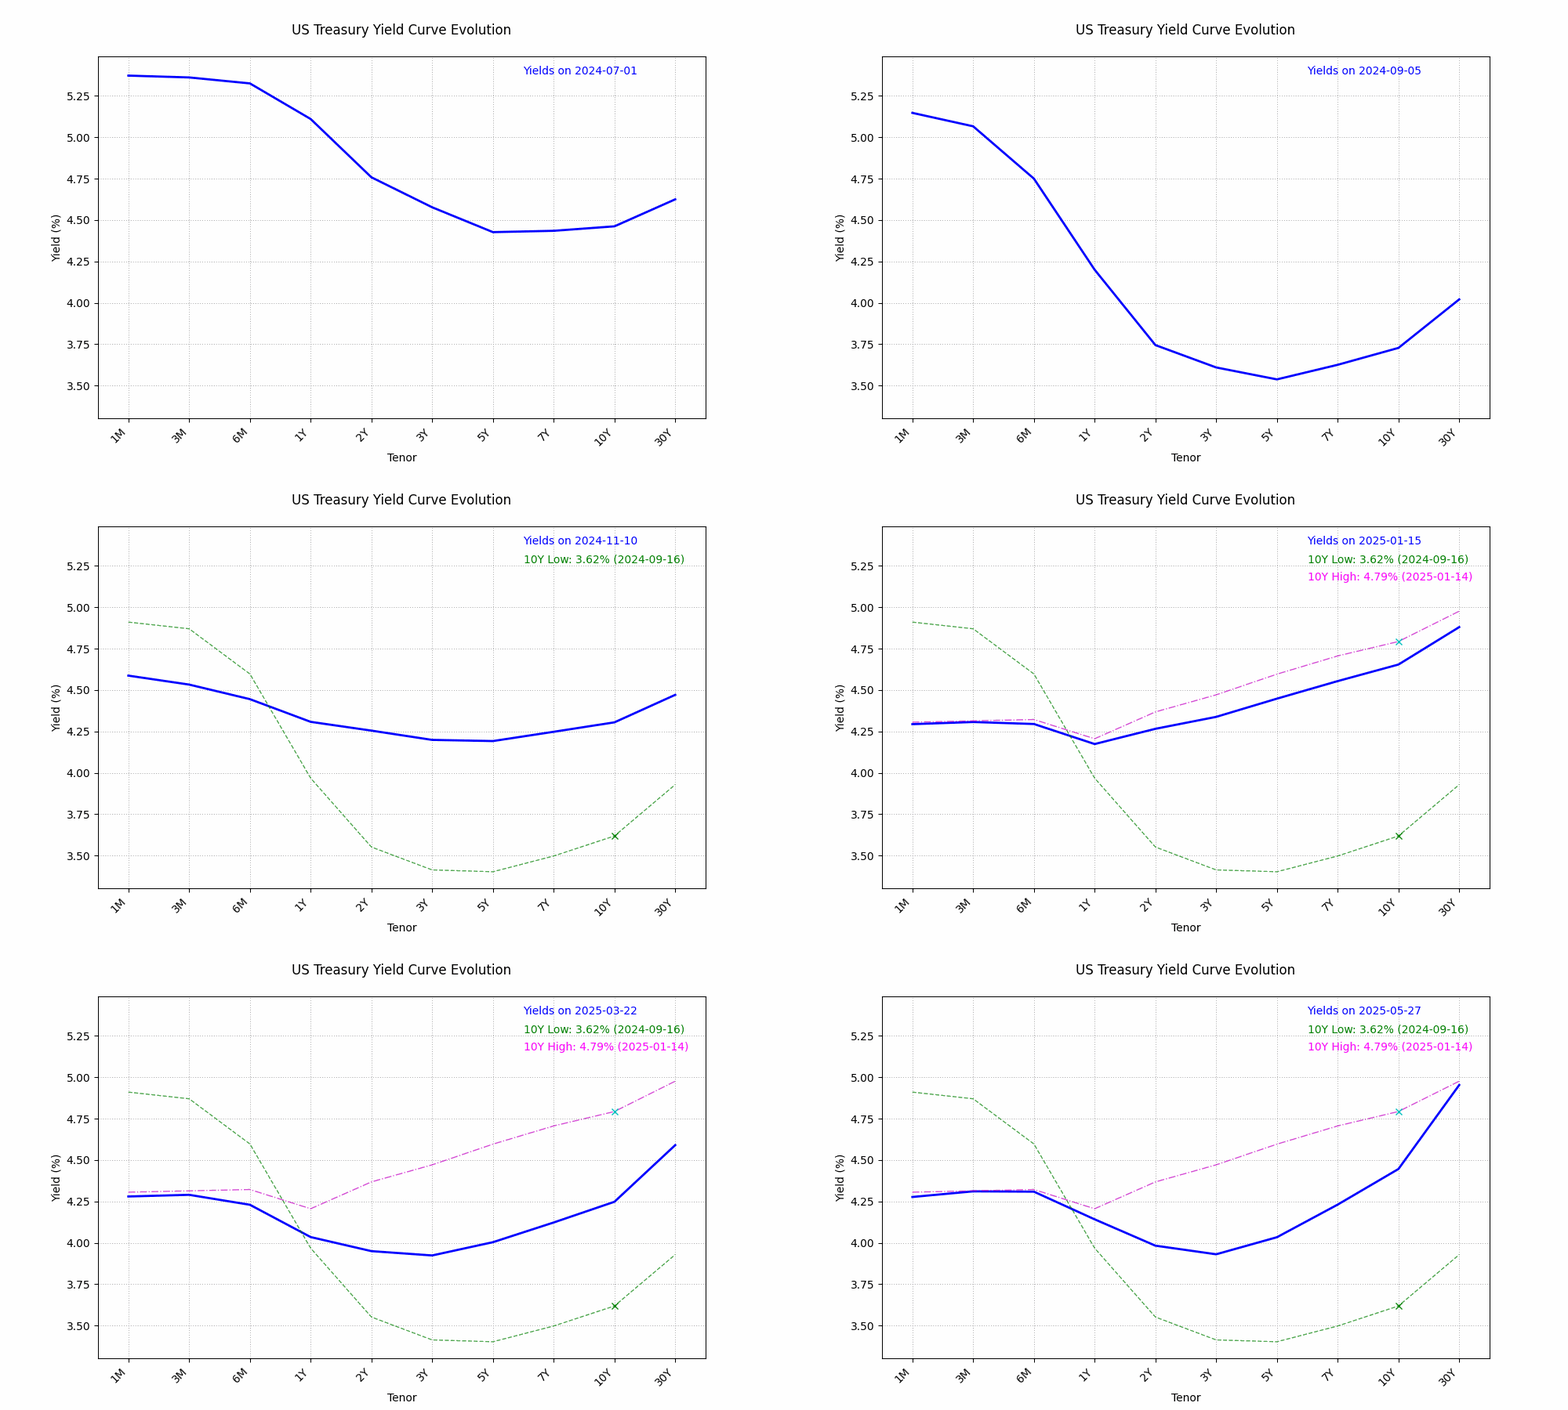
At the front end of the yield curve there has been more concern about the economic outlook. That is coupled with a belief that the Federal Reserve is still likely to cut overnight rates this year. To that end, yields have tracked a lot lower than the long end. From March 2025 onward, the 2-year government bond yield in the U.S. moved from approximately 4.3% to below 3.7%, before bouncing a little back up closer to 4%.
The yield curve still sits close to its steepest level since 2022. Interestingly, the 10-year versus 2-year yield curve spread is also sitting at a level that was very similar to the “soft landing” period of 1995. That followed a rising rate cycle that began in 1994.

Source: Harvest Portfolios Group, Inc., May 2025.
Rebound or recession?
There were calls for a recession in the immediate aftermath of the “Liberation Day” tariff announcement. Fortunately, the quick reversal and move to the 90-day pause cut off those imminent recession calls and improved near-term sentiment. That has also helped to support yields higher across the curve over the past several weeks. Meanwhile, the expectations of Federal Reserve interest rate hikes have shifted quickly from fully pricing in four more cuts by year end 2025, all the way back to less than 2 full cuts by the year end. But uncertainty remains elevated.
Harvest Fixed Income ETFs – How are they impacted by the yield curve?
The movements of the yield curve are important to understand. As bond prices act inversely to their yield movements, the yield curve has moved differently in the short-end, the intermediate, and the long end.
The Harvest Premium Yield 7-10 Year Treasury ETF (HYPM:TSX) invests mostly in the iShares 7-10 Year Treasury Bond ETF. Those bonds mature between that seven to ten year window on the yield curve. On the other hand, a good portion of our Harvest Premium Yield Treasury ETF (HPYT:TSX) rests in the iShares 20+ Year Treasury Bond ETF. The bulk of the bonds in that ETF mature between the 20-to-30 year window on the yield curve. It is important to understand which bonds you own to determine if this aligns with the view on yield curve expectations.
In a soft-landing scenario, longer-dated bond yields could be less likely to experience a decline compared to shorter-dated bond yields, while a minimal spread (steepness) between short and long-dated bonds could be maintained. On the other hand, in a hard landing scenario, longer-dated bonds could be more likely to follow short-dated bonds yields to the downside. This occurs in an environment in which growth and inflation expectations weaken. But shorter-dated bond yields would be likely to decline further as the Federal Reserve slashes overnight rates. The yield curve tends to steepen a lot further in this scenario.
A full spectrum of choice for investors | TBIL, HPYM, HPYT
Harvest Fixed income ETF portfolios cover the full maturity spectrum of government-issued securities, offering both stability and a boost in monthly income through active management. They allow investors to select the portfolio that fits their risk profile and income needs. Each fund sits on different section of the yield curve resulting in them having different sensitivity to interest rate changes (meaning each will experience different volatility in its price per unit, which amounts to differences in capital appreciation/depreciation).
The Harvest Canadian T-Bill ETF (TBIL:TSX), which carries little to no risk to interest rates sits at the short end of the yield curve and is for investors with a short-term investment horizon. HPYM, a “happy medium”, that offers a blend of attractive monthly income from covered calls written on intermediate-term US Treasury ETFs and is for those investors who have a longer investment horizon and can tolerate a greater sensitivity to interest rate changes. And, for investors who are looking for higher levels of monthly income, there is HPYT. HPYT aims to generate higher levels of monthly income by writing covered calls on up to 100% on a portfolio of long-term US Treasury ETFs. It sits on the longer end of the curve and of the three portfolio is the most sensitive to interest rate changes at that level (meaning it will the see most volatility in its price per unit).
So, for safety tied to short-term investments consider TBIL, for high income from investments tied to a mid-range investment horizon with mid-sensitivity to rate changes, consider HPYM and for higher income potential with the most sensitivity to interest changes of the three, consider HPYT.
Disclaimer
The information is meant to provide general information for educational purposes. Any security mentioned herein is for illustration purposes and should not be taken as an invitation to purchase or sell such security. Commissions, management fees and expenses all may be associated with investing in Harvest Exchange Traded Funds (managed by Harvest Portfolios Group Inc.). Please read the relevant prospectus before investing. The funds are not guaranteed, their values change frequently, and past performance may not be repeated.


