Paul MacDonald, Chief Investment Officer, Portfolio Manager, Harvest Portfolios Group Inc.
GLOBAL POPULATIONS ARE AGING
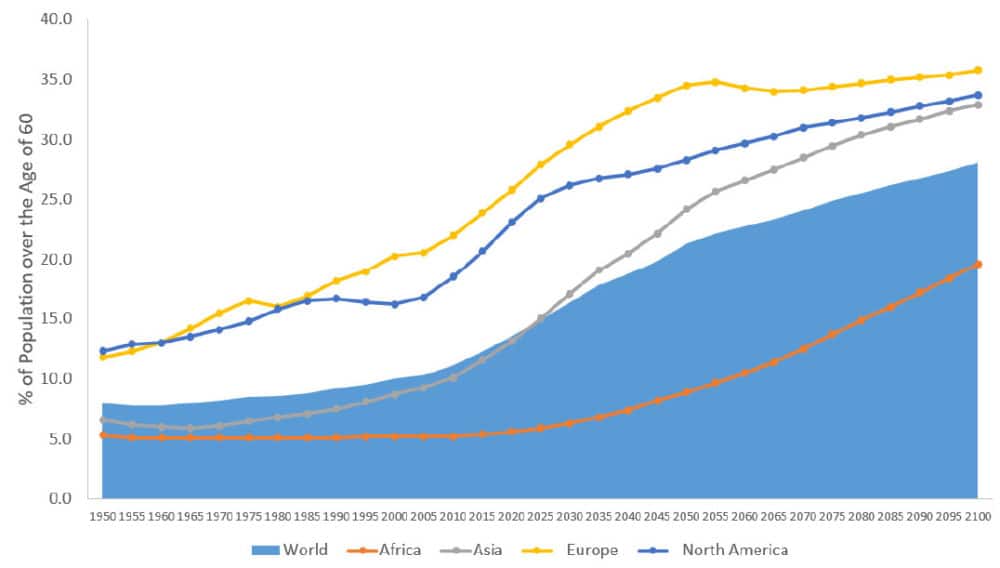
The world’s older population continues to grow at an unprecedented rate. According to a report by the National Institute of Aging1, about 8.5 percent of people worldwide (617 million) are aged 65 and over and this percentage is projected to jump to nearly 17 percent of the world’s population by 2050 (1.6 billion). The aging population is particularly apparent in developed economies where a large cohort is not only aging, but also living longer. The non-cyclical driver of global aging demographics is resulting in increasing demand for healthcare and has multiple positive implications for the Healthcare sector.
Population Over Age 60 by Select Jurisdictions
Source: UN, Department of Economic and Social Affairs, Population Division. World Population Prospects: The 2017 Revision, custom data acquired via website.
These positive implications are compounded by the fact that spending on healthcare and related services tends to increase exponentially as people age.
US Per Capita Total Personal Healthcare Expenditures
Source: Centers for Medicare & Medicaid Services, 2012
DEVELOPING MARKETS : SPENDING SET TO RISE AS WEALTH INCREASES
While the aging population is a global phenomenon, it is more pronounced in developed markets. Developing markets however – some with large populations whose economies are getting wealthier – are also showing signs of escalating healthcare consumption and spending. This represents a key long-term positive driver for the Healthcare sector. Spending has grown substantially and there is a significant difference in spending in developed markets compared to developing markets.
2014 Health Expenditure per capita (US$)
Source: The World Bank, 2016
While it may be some time before economies like China or India inch closer to the global average, there is a clear link between a country’s wealth and its spending on healthcare. The relationship is also non-linear – meaning that as wealth increases in developing markets – there is a disproportionate increase in spending on one’s healthcare needs.
Total Health Expenditure per capita and GDP per capita
Source: OECD Health at a Glance 2011.
HEALTHCARE – A DEFENSIVE SECTOR
The healthcare sector is considered a defensive sector as many of the products and services are considered essential. The sector has had negative annual returns only twice since 2002. Despite having a negative return during the 2008 financial crises, it was the top performing sub-sector in the MSCI World Index. The sector has historically generated attractive risk adjusted returns compared to Canadian Equities, U.S. Equities, Global Equities and Global Bonds. The Healthcare sector in many cases has generated superior returns with lower volatility as highlighted in the chart below.
Healthcare Attractive Historical Risk / Return Profile
Source: Bloomberg, Based on 10 year period ended August 31, 2018.2
DRUG PRICING: POLITICAL LIGHTNING ROD PRESENTS VALUATION OPPORTUNITY
One of the more prominent themes during the US Presidential Election in 2016 was the burgeoning costs of healthcare. For politicians, the topic of drug pricing has become a lightning rod that immediately resonates with the voting base. Shares of pharmaceutical and biotechnology companies during this time quickly became the target and were amongst the most impacted by the political rhetoric, despite being only 10% of overall healthcare expenditures.
Prescriptions Drug Prices – Represent 10 % of Healthcare Expenditures
Source: Centers for Medicare & Medicaid Services, Office of the Acuary, National Health Statistics Group, based on Calendare year 2016.
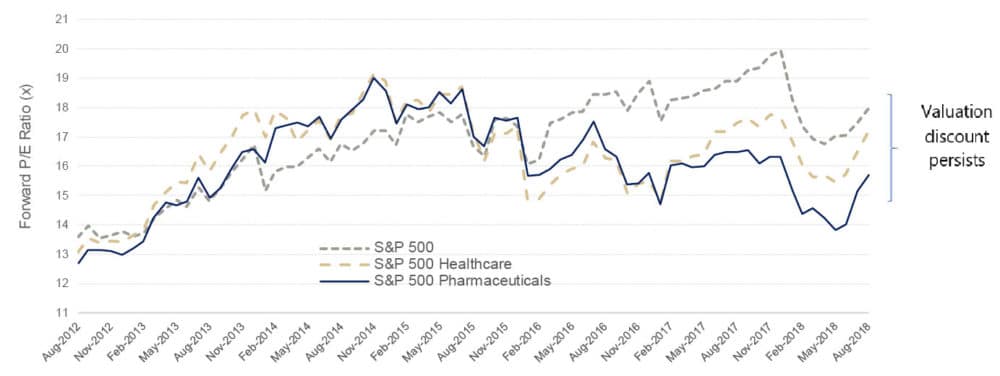
The political rhetoric drove valuations down to a discount to the market, a rare occurrence historically. Over the course of 2018 the discussion has started to transition from prescription drug pricing to broader inefficiencies in the sector – this has caused some narrowing of the valuation discount, however the sector remains attractively valued compared to the broader market.
Healthcare & Pharmaceuticals Offer Compelling Valuation Opportunity
Source: Bloomberg, as at August 31, 2018.
CANADIANS: LIMITED EXPOSURE TO HEALTHCARE
Despite positive long-term growth drivers and defensive characteristics coupled with attractive valuations, the Canadian market remains significantly under-represented in Healthcare compared to larger, more global markets.
S&P 500 Index
S&P TSX Composite
Source: Bloomberg, as at August 31, 2018.
HARVEST HEALTHCARE LEADERS INCOME ETF: CORE STRATEGY WITH ENHANCED INCOME
Harvest Portfolios Group Inc. utilizes a combination of quantitative financial metrics including dividend and free cash flow growth within their Income orientated ETF’s. For those looking for a core Healthcare Focused ETF – the Harvest Healthcare Leaders Income ETF (TSX: HHL) also offers an attractive tax efficient yield.
Investment Highlights
– Global: Global trends driving long-term growth
– Diversified: Portfolio of 20 large capitalization global healthcare leaders
– Attractive Income: Monthly income with opportunity for capital appreciation, $0.0583 per unit
– Covered Call Strategy: Can enhance portfolio income and lower portfolio volatility
– Hedged: HHL unit currency hedged; HHL.U trades in USD and is unhedged
World Class Portfolio (As at August 31, 2018)
1. https://www.census.gov/content/dam/Census/library/publications/2016/demo/p95-16-1.pdf
2. As measured in local currency. Indices: “CDN Equities” represented by the S&P/TSX Composite Total Return Index; “Global Bonds” represented by the JPM Aggregate Bond Index Total Return USD undhedged; “Global Equities” represented by the MSCI Daily Total Return World Index; “Global Healthcare” is represented by the MSCI Daily Total Return World Gross Healthcare Index; and “U.S. Equities” represented by the S&P 500 Total Return Index.
You will usually pay brokerage fees to your dealer if you purchase or sell units of the Fund(s) on the TSX. If the units are purchased or sold on the TSX, investors may pay more than the current net asset value when buying units of the Fund(s) and may receive less than the current net asset value when selling them. There are ongoing fees and expenses associated with owning units of an investment fund. Investment funds are not guaranteed, their values change frequently, and past performance may not be repeated. An investment fund must prepare disclosure documents that contain key information about the fund. You can find more detailed information about the fund in these documents.
Certain statements in this communication are forward looking Forward-looking statements (“FLS”) are statements that are predictive in nature, depend upon or refer to future events or conditions, or that include words such as “may,” “will,” “should,” “could,” “expect,” “anticipate,” “intend,” “plan,” “believe,” or “estimate,” or other similar expressions. Statements that look forward in time or include anything other than historical information are subject to risks and uncertainties, and actual results, actions or events could differ materially from those set forth in the FLS.
FLS are not guarantees of future performance and are by their nature based on numerous assumptions, which include, amongst other things, that (i) the Fund can attract and maintain investors and have sufficient capital under management to affect their investment strategies, (ii) the investment strategies will produce the results intended by the portfolio managers, and (iii) the markets will react and perform in a manner consistent with the investment strategies. Although the FLS contained herein are based upon what the portfolio manager believes to be reasonable assumptions, the portfolio manager cannot assure that actual results will be consistent with these FLS.
Unless required by applicable law, Harvest Portfolios Group Inc. does not undertake, and specifically disclaim, any intention or obligation to update or revise any FLS, whether as a result of new information, future events or otherwise.


