By Ambrose O’Callaghan
Last month, we looked at how investors should aim to navigate bond volatility in 2025 and potentially beyond. This piece was published the day after the United States Federal Reserve (Fed) slashed its key interest rate by 25 basis points on December 18, 2024. This brought the policy rate from 5.5% at the start of 2024 to 4.5%.
Higher for longer vs. Higher and higher | Yield curve surprises and spreads
Recent inflationary risks have been driven by stronger economic data and potential policy risks. That, in turn, has caused the yield curve to surprisingly move meaningfully higher.
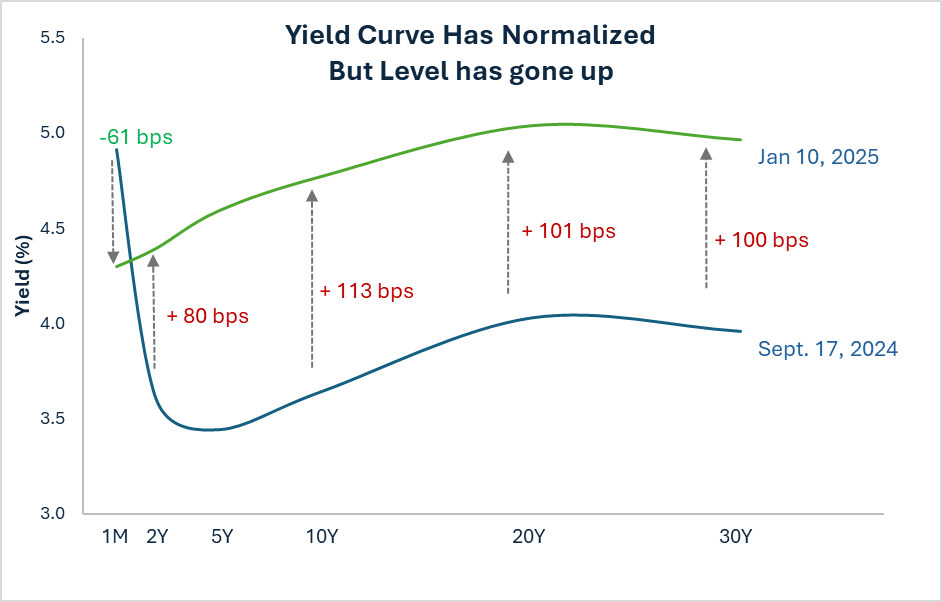
Source: Harvest Portfolios Group, Inc., January 2025.
There are a few developments investors should be watching when it comes to yield. Canadian rates have been falling, while rates in the United States have been climbing. Indeed, these rates are now at the widest differential in three decades. This illustrates the wide gulf in economic fortunes that the two countries have experienced since the end of the COVID-19 pandemic. Canada’s growth has fallen behind its peers in the G7, while the United States’ economy has picked up to become the envy of the world as we start 2025.
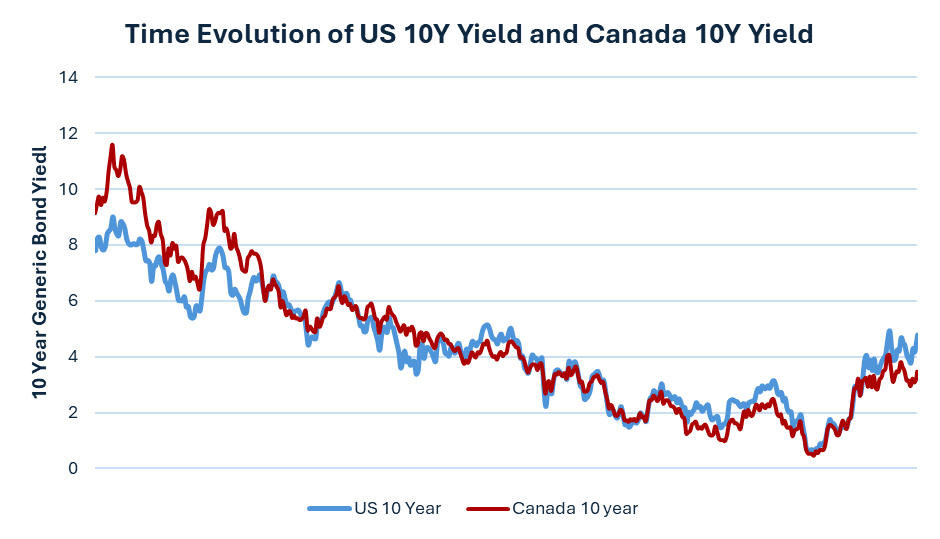
Source: Harvest Portfolios Group, Inc. January 2025.
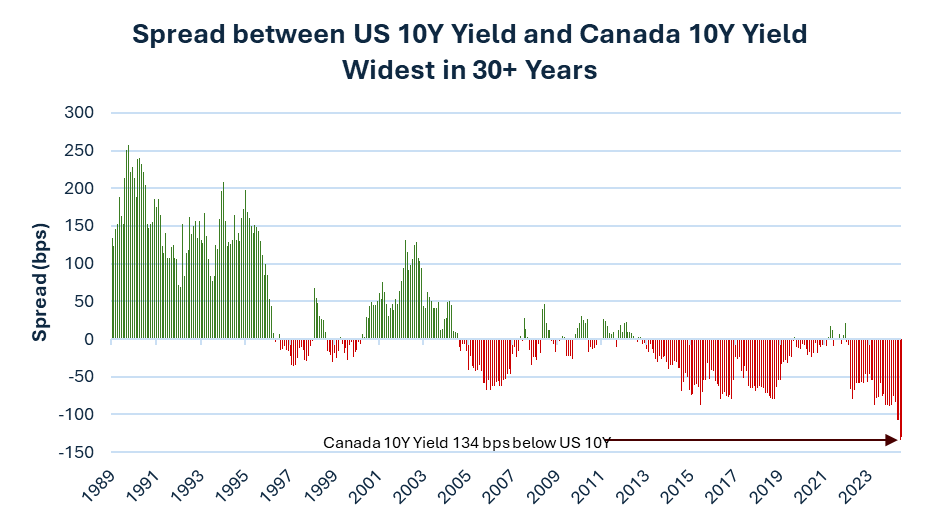
Source: Harvest Portfolios Group, Inc. January 2025.
Expectations in the fixed income space
In September 2024, the market expected the Fed Funds rate to be at 3% by the end of 2025. The last few months illustrate how quickly expectations can shift in a short amount of time.
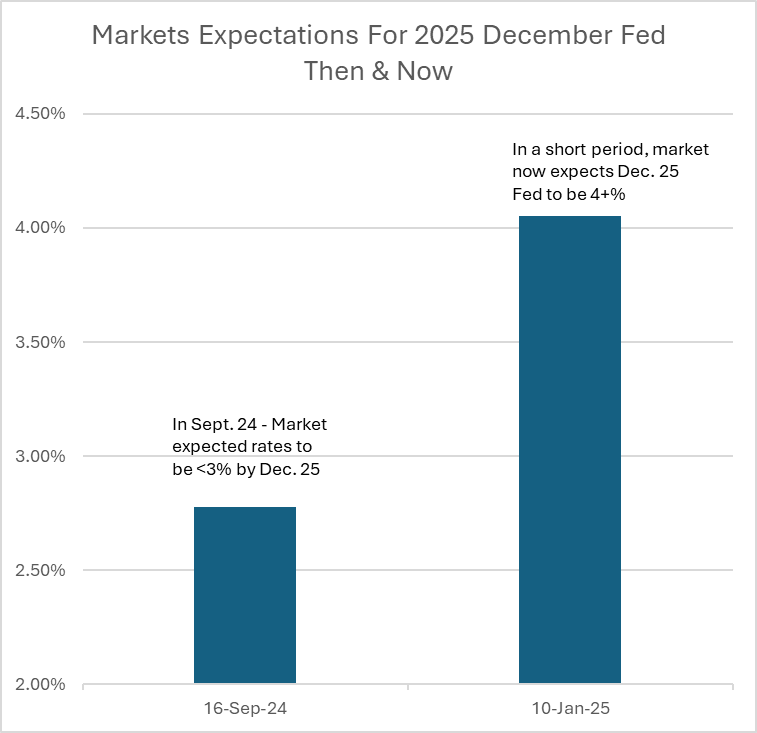
Source: Bloomberg. Represents rates utilizing implied Fed futures. For illustration only.
Presently, the market expects that rates will be nearly 4+% this year. This means that today, the Fed is expected to cut interest rates by 125 basis points less than was expected in September 2024.
When we look back at the same data in 2022, the market had expected the Fed to hike 3 times. In reality, we got 17 effective hikes.
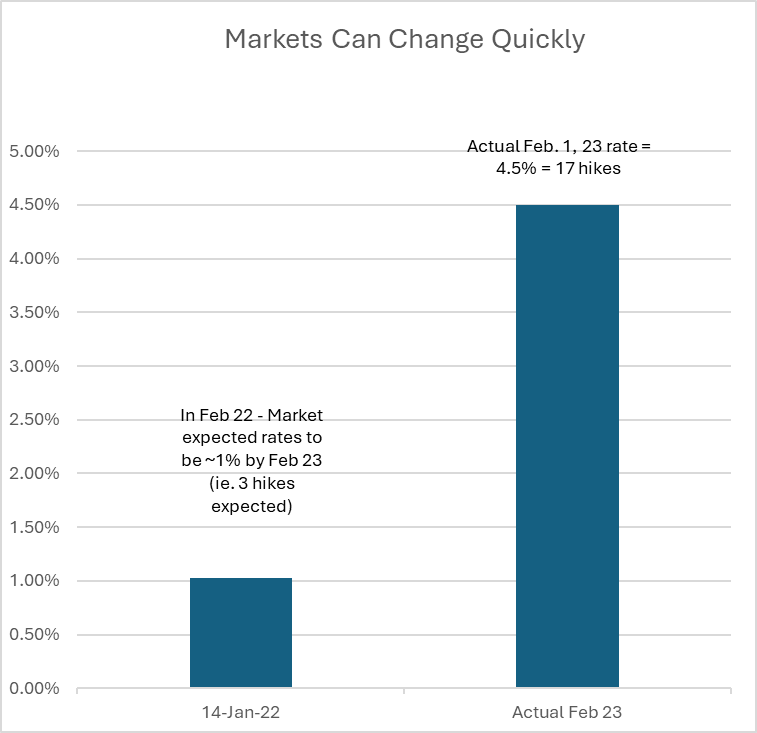
Source: Bloomberg. Represents rates utilizing implied Fed futures. For illustration only.
What can investors glean from this? The biggest takeaway is that expectations can change rapidly and meaningfully over a relatively short period for the market. For Harvest covered call bond ETFs, big movements in the yield curve are challenging. Indeed, these funds will be exposed to the duration of the bonds. However, the Harvest portfolio management team reiterates that the cash flow is a critical component when monthly moves are more volatile and that they can be tactical during times of extreme moves, writing more options or writing less options depending on market dynamics.
One of the drivers from the recent move higher in rates has been potential inflationary risks due to the incoming US administration’s policies, such as those linked to tariffs. The proposed prior to taking office by the incoming administration may indeed take time to implement and may in fact be substantially different than proposed. This is especially true for tariffs. Our portfolio management team believes that either the proposed policies will have to be implemented and result in higher inflation. Stronger economic data points to higher inflation to sustain the move through 5% on the 20-year US bond. However, inflation and policy risks, are likely to remain a cloud over the near term.
Harvest Fixed Income ETFs to watch in 2025
In September 2023, Harvest launched its first Fixed Income ETF – the Harvest Premium Yield Treasury ETF (HPYT:TSX). HPYT is a portfolio of ETFs that holds longer dated US Treasury bonds that are secured by the full faith and credit of the US government. It employs up to 100% covered call writing to generate a high monthly cash flow.
Over its lifespan, HPYT has paid out a consistent monthly cash distribution of $0.15 per unit. Moreover, HPYT has paid out a total monthly distribution of $2.25 per unit since its inception.
The Harvest Premium Yield 7-10 Year Treasury ETF (HPYM:TSX) was launched in January 2024. It seeks to provide attractive and tax efficient monthly cash distributions to Unitholders by writing covered calls on a portfolio of US Treasury ETFs that primarily hold mid-duration US bonds with average maturities of 7-10 years. It last paid out a monthly cash distribution of $0.80 per unit. That represents a current yield of 8.80% as at January 17, 2025.
Finally, for investors who want a low-risk cash vehicle, there is the Harvest Canadian T-Bill ETF (TBIL:TSX). This ETF pays competitive interest income that comes from investing in Treasury Bills issued by the Government of Canada. It last paid out a monthly cash distribution of $0.1451 per unit and has paid out total monthly distributions of $2.1168 since its inception.
Disclaimer
Commissions, management fees and expenses all may be associated with investing in Harvest Exchange Traded Funds, managed by Harvest Portfolios Group Inc. (the Fund(s)). Please read the relevant prospectus before investing. The Funds are not guaranteed, their values change frequently, and past performance may not be repeated. Tax investment and all other decisions should be made with guidance from a qualified professional.
The current yield represents an annualized amount that is comprised of 12 unchanged monthly distributions (using the most recent month’s distribution figure multiplied by 12) as a percentage of the closing market price of the Fund. The current yield does not represent historical returns of the ETF but represents the distribution an investor would receive if the most recent distribution stayed the same going forward.
Certain statements included in this communication constitute forward-looking statements (“FLS”), including, but not limited to, those identified by the expressions “expect”, “intend”, “will” and similar expressions to the extent they relate to the Fund. The FLS are not historical facts but reflect Harvest’s, the Manager of the Fund, current expectations regarding future results or events. These FLS statements are subject to a number of risks and uncertainties that could cause actual results or events to differ materially from current expectations. Although Harvest, the Manager of the Fund, believes that the assumptions inherent in the FLS are reasonable, FLS are not guarantees of future performance and, accordingly, readers are cautioned not to place undue reliance on such statements due to the inherent uncertainty therein. Harvest, the Manager of the Fund, undertakes no obligation to update publicly or otherwise revise any FLS or information whether as a result of new information, future events or other such factors which affect this information, except as required by law.