Key Facts
As at 2024/04/26
TICKER
HBLK
TSX
CURRENCY
CAD
Unhedged
NAV
$15.41
Updated Daily
MKT PRICE CLOSE
$15.38
Updated Daily
NET AUM*
$23.26M
Updated Daily
MGMT STYLE
Index
-
DISTRIBUTIONS
Annually
If any
REBALANCE
Quarterly
Portfolio
MGMT FEE
0.65%
Annual
INCEPTION DATE
Jan. 31
2018
Portfolio Analysis‡
As at March 28, 2024
|
Number of Equity Securities: 40 |
|
Average Market Capitalization (CAD): $270B |
|
Average Market Capitalization for Emerging (CAD): $24.90B |
|
Average Market Capitalization for Large Cap (CAD): $755B |
|
Average P/E 138.1x |
|
Average 5 Year Return on Equity 2.44% |
|
Emerging Weighting: 66.00% |
|
Large Cap Weighting: 33.30% |
Blockchain Industry Allocation
As at March 28, 2024
Holdings
As at March 28, 2024
| Name | Ticker | Weight | Sector | Country |
|---|---|---|---|---|
| Coinbase Global, Inc. | COIN US | 9.3% | Crypto Trading/ Wallets | United States |
| Block, Inc. | SQ US | 7.8% | Crypto Trading/ Wallets | United States |
| CleanSpark, Inc. | CLSK US | 6.7% | Crypto Miners | United States |
| EPAM Systems, Inc. | EPAM US | 5.6% | Software/ Tech Services | United States |
| Marathon Digital Holdings, Inc. | MARA US | 5.6% | Crypto Miners | United States |
| Riot Platforms, Inc. | RIOT US | 4.6% | Crypto Miners | United States |
| Beyond, Inc. | BYON US | 4.4% | Other Blockchain | United States |
| Nuvei Corporation | NVEI CN | 3.8% | Payment Processors | Canada |
| Oracle Corporation | ORCL US | 3.8% | Large Cap | United States |
| SAP SE | SAP US | 3.6% | Large Cap | United States |
| Mastercard Incorporated | MA US | 3.5% | Large Cap | United States |
| International Business Machines Corporation | IBM US | 3.4% | Large Cap | United States |
| Microsoft Corporation | MSFT US | 3.4% | Large Cap | United States |
| Visa Inc. | V US | 3.3% | Large Cap | United States |
| Intel Corporation | INTC US | 3.2% | Large Cap | United States |
| Accenture PLC | ACN US | 3.1% | Large Cap | United States |
| Wipro Limited | WIT US | 3.0% | Large Cap | United States |
| Galaxy Digital Holdings Ltd. | GLXY CN | 2.9% | Digital Assets & Services | Canada |
| Infosys Limited | INFY US | 2.9% | Large Cap | United States |
| Hut 8 Corp. | HUT CN | 2.4% | Crypto Miners | Canada |
| Conduent Incorporated | CNDT US | 2.0% | Software/ Tech Services | United States |
| Paysafe Limited | PSFE US | 2.0% | Payment Processors | United States |
| Bitfarms Ltd. | BITF CN | 1.6% | Crypto Miners | Canada |
| Bitdeer Technologies Group | BTDR US | 1.3% | Crypto Miners | United States |
| X3 Holdings Co., Ltd. | XTKG US | 1.2% | Software/ Tech Services | United States |
| TeraWulf Inc. | WULF US | 1.1% | Crypto Miners | United States |
| HIVE Digital Technologies Ltd. | HIVE CN | 0.8% | Crypto Miners | Canada |
| Bit Digital, Inc. | BTBT US | 0.7% | Crypto Miners | United States |
| Cash and other assets and liabilities | 0.7% | |||
| Iris Energy Limited | IREN US | 0.6% | Crypto Miners | United States |
| Argo Blockchain PLC | ARBK US | 0.4% | Crypto Miners | United States |
| DeFi Technologies Inc. | DEFI CN | 0.4% | DeFi (Decentralized Finance) | Canada |
| Bakkt Holdings, Inc. | BKKT US | 0.2% | Digital Assets & Services | United States |
| DMG Blockchain Solutions Inc. | DMGI CN | 0.2% | Crypto Miners | Canada |
| Ether Capital Corporation | ETHC CN | 0.2% | Transaction Processing/ Staking | Canada |
| BIGG Digital Assets Inc. | BIGG CN | 0.1% | Digital Assets & Services | Canada |
| BIT Mining Limited | BTCM US | 0.1% | Crypto Miners | United States |
| Stronghold Digital Mining, Inc. | SDIG US | 0.1% | Crypto Miners | United States |
| Imperalis Holding Corp. | IMHCW US | 0.0% | Crypto Miners | United States |
| NetCents Technology Inc. | NC CN | 0.0% | Payment Processors | Canada |
| Voyager Digital Ltd. | VOYG CN | 0.0% | Crypto Trading/ Wallets | Canada |
Annualized Performance
As at March 31, 2024
| Ticker | 1M | 3M | 6M | YTD | 1Y | 2Y | 3Y | 4Y | 5Y | SI |
|---|---|---|---|---|---|---|---|---|---|---|
| HBLK | 3.39 | 12.09 | 77.46 | 12.09 | 66.86 | (3.50) | (10.90) | 33.17 | 19.92 | 9.16 |
Calendar Year Performance †
As at March 31, 2024
| Ticker | 2023 | 2022 | 2021 | 2020 | 2019 | 2018 |
|---|---|---|---|---|---|---|
| HBLK | 80.70 | (62.31) | 41.73 | 149.81 | 21.10 | (47.60) |
Cumulative Growth $10,000 Invested
(NAV pricing)
The “Growth of $10,000 invested” chart shows the final value of a hypothetical $10,000 investment in securities in this class/series of the fund as at the end of the investment period indicated and is not intended to reflect future values or returns on investment in such securities.
HBLK Historical Daily Prices (CLICK HERE)
Distributions
|
Last Ex-dividend Date: 2021/12/30 |
|
Last Record Date: 2021/12/31 |
|
Last Distribution Per Unit: $3.8295 |
|
Cash Distribution Frequency: Annually, if any |
| Ex-dividend Date | Record Date | Payment Date | Class A | Distribution Frequency |
|---|---|---|---|---|
| 2021/12/30 | 2021/12/31 | 2021/12/31 | $3.8295 | Notional** |
** Notional non-cash distributions are paid annually (if any). There is no impact on net asset value per unit. The notional distribution is added to the cost base of the ETF and is taxable if not held in a registered account (RSP/RIF/TFSA and RESP).
Documents
 |
| Product Sheet |
 |
| Investor Brochure |
 |
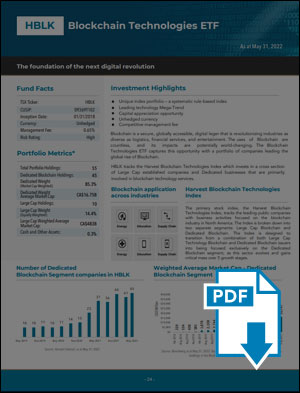
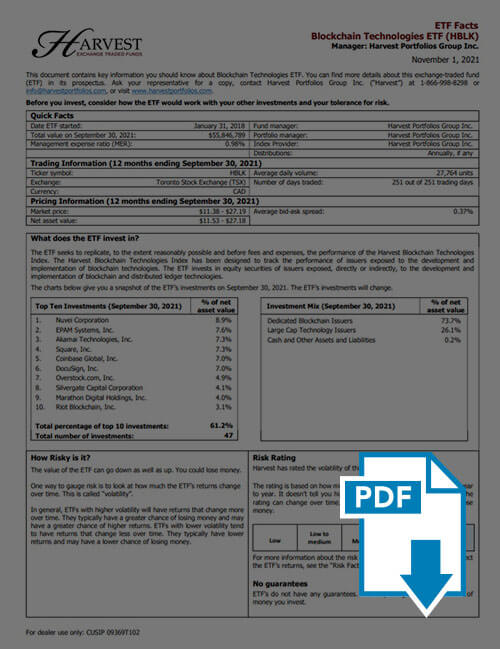
| ETF Facts |
| Document | Language | Type | |
|---|---|---|---|
| Product Sheet | English | French | Fund Documents |
| Investor Booklet | English | - | Fund Documents |
| ETF Facts | English | French | Regulatory |
| Prospectus | English | French | Regulatory |
| ETF Products Booklet | English | French | Information Materials |
| MER Summary | English | French | Information Materials |
| 2023 Annual Financial Statements | English | French | Statements/MRFPs |
| 2023 Annual Management Report of Fund Performance | English | French | Statements/MRFPs |
| 2023 Quarterly Summary - Q3 | English | - | Portfolio Disclosure |
| 2023 Quarterly Summary - Q1 | English | - | Portfolio Disclosure |
| Index Rule Book | English | - | Index Rule Book |
| PFIC Annual Information Statement | English | - | Information Materials |
| Proxy Voting Policy | English | - | Proxy Voting |
| July 1, 2022 to June 30, 2023 Proxy Summary | English | - | Proxy Voting |
HBLK Historical Documents (CLICK HERE)
Investment Goal
Blockchain Technologies ETF invests in equity securities that are exposed, directly or indirectly, to the development and implementation of blockchain technologies. The portfolio is comprised of a cross section of large-cap established companies and stand alone, emerging blockchain companies. The ETF seeks to track the performance of the Harvest Blockchain Technologies Index and is designed for capital appreciation opportunity.
Benefits of investing in HBLK
|
 |
Key ETF Details
As at March 28, 2024
| ETF Details | Unit |
|---|---|
| TSX Code | HBLK |
| CUSIP | 09369T102 |
| Currency | CAD-Unhedged |
| Inception Date | 2018/01/31 |
| Management Style | Index |
| Eligible | RRSP | RRIF | RESP | TFSA |
| Portfolio Rebalancing | Quarterly |
| Management Fee | 0.65% |
| Distribution Frequency | Annually, if any |
| Risk Rating |
Relevant Posts
What crypto challenges and Blockchain resilience mean for one Blockchain ETF | HBLK
Portfolio manager outlines the blockchain landscape for 2022 and…
Harvest’s 3 Market Megatrend ETFs
Harvest Portfolios Group’s Exchange Traded Funds (ETFs) focus on growth and income through the ownership…
Tech ETFs, banks top performers for Harvest in 2021
By Michael Kovacs, CEO
A relief rally that began in January…
Disclaimer
Blockchain Technologies ETF
Commissions, management fees and expenses all may be associated with investing in Harvest Exchange Traded Funds (managed by Harvest Portfolios Group Inc.). Please read the relevant prospectus before investing.The indicated rates of return are the historical annual compounded total returns (except for figures of one year or less, which are simple total returns) including changes in unit value and reinvestment of all distributions and do not take into account sales, redemption, distribution or optional charges or income taxes payable by any securityholder that would have reduced returns.The funds are not guaranteed, their values change frequently and past performance may not be repeated. Tax investment and all other decisions should be made with guidance from a qualified professional.
* Represents aggregate AUM of all classes denominated in Canadian dollars.
** Notional non-cash distributions are paid annually (if any). There is no impact on net asset value per unit. The notional distribution is added to the cost base of the ETF and is taxable if not held in a registered account (RSP/RIF/TFSA and RESP).
† The first year of Calendar Year Performance presents the rate of return from commencement of operations to December 31 of that year.
‡ Source: Bloomberg. Average statistics calculated based on portfolio weighted average. Dividend yield (gross) based on Bloomberg indicated 12 month yield of portfolios positions and does not represent the distribution yield paid to investors. The above information is for illustrative purposes only, is estimated and unaudited.


