Key Facts
As at 2025/09/17
TICKER
HCLN
TSX
CURRENCY
CAD
Unhedged
NAV
$9.21
Updated Daily
MKT PRICE CLOSE
$9.23
Updated Daily
NET AUM*
$18.41M
Updated Daily
MGMT STYLE
Rules-Based
-
DISTRIBUTIONS
Annually
If any
REBALANCE
Semi-annually
Portfolio
MGMT FEE
0.40%
Annual
INCEPTION DATE
Jan. 14
2021
Portfolio Analysis‡
As at August 29, 2025
|
Number of Equity Securities: 40 |
|
Average Market Capitalization (CAD): $8B |
|
Average P/E: 19.3x |
|
Average 5 Year Return on Equity: 6.32% |
|
As at August 29, 2025 |
|
As at August 29, 2025 |
Holdings
As at August 29, 2025
| Name | Ticker | Weight | Sector | Country |
|---|---|---|---|---|
| Sunrun Inc. | RUN US | 3.8% | Solar Equipment & Services | United States |
| Solaria Energía y Medio Ambiente, S.A. | SLR SM | 3.2% | Renewable Power Generation | Spain |
| Daqo New Energy Corp. | DQ US | 3.1% | Solar Equipment & Services | United States |
| SolarEdge Technologies, Inc. | SEDG US | 3.1% | Solar Equipment & Services | United States |
| EnerSys | ENS US | 2.9% | Battery & Energy Storage Equipment | United States |
| Eos Energy Enterprises, Inc. | EOSE US | 2.8% | Battery & Energy Storage Equipment | United States |
| First Solar, Inc. | FSLR US | 2.8% | Solar Equipment & Services | United States |
| Xinyi Solar Holdings Limited | 968 HK | 2.7% | Solar Equipment & Services | China |
| ERG S.p.A. | ERG IM | 2.6% | Renewable Power Generation | Italy |
| Nordex SE | NDX1 GR | 2.5% | Wind Equipment & Services | Germany |
| Ormat Technologies, Inc. | ORA US | 2.5% | Renewable Power Generation | United States |
| ReNew Energy Global PLC | RNW US | 2.5% | Renewable Power Generation | United States |
| Scatec ASA | SCATC NO | 2.5% | Renewable Power Generation | Norway |
| Vestas Wind Systems A/S | VWS DC | 2.5% | Wind Equipment & Services | Denmark |
| Cash and other assets and liabilities | 2.5% | |||
| Cadeler A/S | CADLR NO | 2.4% | Wind Equipment & Services | Norway |
| EDP Renováveis, S.A. | EDPR PL | 2.4% | Renewable Power Generation | Portugal |
| JinkoSolar Holding Co., Ltd. | JKS US | 2.4% | Solar Equipment & Services | United States |
| Landis+Gyr Group AG | LAND SW | 2.4% | Other Equipment & Services | Switzerland |
| Mercury NZ Limited | MCY NZ | 2.4% | Renewable Power Generation | New Zealand |
| Northland Power Inc. | NPI CN | 2.4% | Renewable Power Generation | Canada |
| Boralex Inc. | BLX CN | 2.3% | Renewable Power Generation | Canada |
| Brookfield Renewable Corporation | BEPC CN | 2.3% | Renewable Power Generation | Canada |
| CGN New Energy Holdings Co., Ltd. | 1811 HK | 2.3% | Renewable Power Generation | China |
| Contact Energy Limited | CEN NZ | 2.3% | Renewable Power Generation | New Zealand |
| Corporación Acciona Energías Renovables, S.A. | ANE SM | 2.3% | Renewable Power Generation | Spain |
| Enphase Energy, Inc. | ENPH US | 2.3% | Solar Equipment & Services | United States |
| GCL Technology Holdings Limited | 3800 HK | 2.3% | Solar Equipment & Services | China |
| Grenergy Renovables, S.A. | GRE SM | 2.3% | Renewable Power Generation | Spain |
| Meridian Energy Limited | MEL NZ | 2.3% | Renewable Power Generation | New Zealand |
| VERBUND AG | VER AV | 2.3% | Renewable Power Generation | Austria |
| Xinyi Energy Holdings Limited | 3868 HK | 2.3% | Renewable Power Generation | China |
| China Longyuan Power Group Corporation Limited | 916 HK | 2.2% | Renewable Power Generation | China |
| Clearway Energy, Inc. | CWEN/A US | 2.2% | Renewable Power Generation | United States |
| Drax Group PLC | DRX LN | 2.2% | Renewable Power Generation | United Kingdom |
| PNE AG | PNE3 GR | 2.2% | Wind Equipment & Services | Germany |
| Fluence Energy, Inc. | FLNC US | 2.1% | Battery & Energy Storage Equipment | United States |
| Plug Power Inc. | PLUG US | 2.1% | Hydrogen & Fuel Cell Equipment | United States |
| thyssenkrupp nucera AG & Co. KGaA | NCH2 GR | 2.0% | Hydrogen & Fuel Cell Equipment | Germany |
| Verbio SE | VBK GR | 1.9% | Biofuels | Germany |
| Orsted A/S | ORSTED DC | 1.5% | Renewable Power Generation | Denmark |
Annualized Performance
| Ticker | 1M | 3M | 6M | YTD | 1Y | 2Y | 3Y | 4Y | SI |
|---|---|---|---|---|---|---|---|---|---|
| HCLN | 2.96 | 17.52 | 19.84 | 15.22 | 4.74 | (7.67) | (13.78) | (12.89) | (16.01) |
Calendar Year Performance †
| Ticker | 2024 | 2023 | 2022 | 2021 |
|---|---|---|---|---|
| HCLN | (21.33) | (22.24) | (15.03) | (25.69) |
Cumulative Growth $10,000 Invested
(NAV pricing)
The “Growth of $10,000 invested” chart shows the final value of a hypothetical $10,000 investment in securities in this class/series of the fund as at the end of the investment period indicated and is not intended to reflect future values or returns on investment in such securities.
HCLN Historical Daily Prices (CLICK HERE)
Distributions
|
Last Ex-dividend Date: 2024/12/31 |
|
Last Record Date: 2024/12/31 |
|
Last Distribution Per Unit: $0.1066 |
|
Cash Distribution Frequency: Annually, if any |
| Ex-dividend Date | Record Date | Payment Date | Class A | Distribution Frequency |
|---|---|---|---|---|
| 2024/12/31 | 2024/12/31 | 2024/12/31 | $0.1066 | Notional** |
| 2023/12/28 | 2023/12/29 | 2023/12/29 | $0.1740 | Notional** |
| 2022/12/29 | 2022/12/30 | 2022/12/30 | $0.1398 | Notional** |
| 2021/12/30 | 2021/12/31 | 2021/12/31 | $0.0898 | Notional** |
** Notional non-cash distributions are paid annually (if any). There is no impact on net asset value per unit. The notional distribution is added to the cost base of the ETF and is taxable if not held in a registered account (RSP/RIF/TFSA and RESP).
Documents
| Document | Language | Type | |
|---|---|---|---|
| Product Sheet | English | French | Fund Documents |
| ETF Facts | English | French | Regulatory |
| Prospectus | English | French | Regulatory |
| ETF Products Booklet | English | French | Information Materials |
| MER Summary | English | French | Information Materials |
| 2025 Quarterly Summary - Q1 | English | - | Portfolio Disclosure |
| 2024 Quarterly Summary - Q3 | English | - | Portfolio Disclosure |
| 2025 Interim Financial Statements | English | French | Statements/MRFPs |
| 2025 Interim Management Report of Fund Performance | English | French | Statements/MRFPs |
| 2024 Annual Financial Statements | English | French | Statements/MRFPs |
| 2024 Annual Management Report of Fund Performance | English | French | Statements/MRFPs |
| 2024 Annual Distributions Summary | English | - | Information Materials |
| PFIC Annual Information Statement | English | - | Information Statement |
| IRS Form 8937 | English | - | Tax Form |
| Proxy Voting Policy | English | - | Proxy Voting |
| Proxy Voting Records | English | - | Proxy Voting |
HCLN Historical Documents (CLICK HERE)
Investment Goal
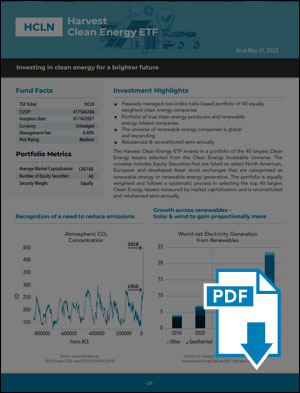
The Harvest Clean Energy ETF invests in a portfolio of the 40 largest Clean Energy Issuers selected from the Clean Energy Investable Universe to provide Unitholders with the opportunity for capital appreciation. The universe includes Equity Securities that are listed on select North American, European and developed Asian stock exchanges that are categorized as renewable energy or renewable energy generation. The portfolio is equally weighted and follows a systematic process in selecting the top 40 largest Clean Energy Issuers measured by market capitalization and is reconstituted and rebalanced semi-annually.
Harvest believes that the changing landscape for renewable energy production and investment represents a long term structural change and is an environment that the Clean Energy sub-sectors are well positioned to benefit from over the long term.
Benefits of investing in HCLN
|
 |
Key ETF Details
As at August 29, 2025
| ETF Details | Unit |
|---|---|
| TSX Code | HCLN |
| CUSIP | 41754G106 |
| Currency | CAD-Unhedged |
| Inception Date | 2021/01/14 |
| Management Style | Rules-Based |
| Eligible | RRSP | RRIF | RESP | TFSA | FHSA |
| Portfolio Rebalancing | Semi-annually |
| Management Fee | 0.40% |
| Distribution Frequency | Annually, if any |
| Risk Rating |
Relevant Posts
Capturing the Rise of Renewables with one ETF | HCLN
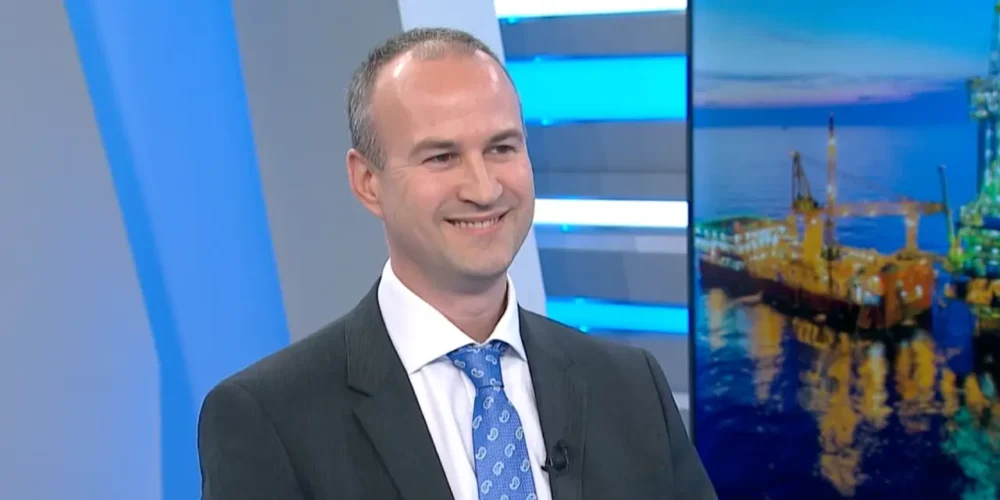
Harvest ETFs President & CEO Michael Kovacs explains the huge…
“Correction” Harvest ETFs Announces Change Correction to Risk Rating of Harvest Clean Energy ETF
Harvest Portfolios Group Inc…
Relevant Insights
Disclaimer
Harvest Clean Energy ETF
Commissions, management fees and expenses all may be associated with investing in Harvest Exchange Traded Funds (managed by Harvest Portfolios Group Inc.). Please read the relevant prospectus before investing.The indicated rates of return are the historical annual compounded total returns (except for figures of one year or less, which are simple total returns) including changes in unit value and reinvestment of all distributions and do not take into account sales, redemption, distribution or optional charges or income taxes payable by any securityholder that would have reduced returns.The funds are not guaranteed, their values change frequently and past performance may not be repeated. Tax investment and all other decisions should be made with guidance from a qualified professional.
* Represents aggregate AUM of all classes denominated in Canadian dollars.
** Notional non-cash distributions are paid annually (if any). There is no impact on net asset value per unit. The notional distribution is added to the cost base of the ETF and is taxable if not held in a registered account (RSP/RIF/TFSA and RESP).
† The first year of Calendar Year Performance presents the rate of return from commencement of operations to December 31 of that year.
‡ Source: Bloomberg. Average statistics calculated based on portfolio weighted average. Dividend yield (gross) based on Bloomberg indicated 12 month yield of portfolios positions and does not represent the distribution yield paid to investors. The above information is for illustrative purposes only, is estimated and unaudited.


