By Ambrose O’Callaghan
The United States Presidential Election is set to take place on November 5, 2024. July represented a historical turning point for the election and potentially the country as several major events resulted in a re-orienting of the race. The sitting US President, Joe Biden, withdrew from the race and endorsed his Vice President’s candidacy.
The candidates for the 2024 US Presidency are now officially locked in with the race set between the Democratic Party’s Vice President – Kamala Harris – and the Republican Party is once again led by Donald J. Trump.
The economy is almost always the number one priority among voters coming into a Presidential Election. This year is no different. Earlier in 2024, Pew Research Center revealed that strengthening the economy was Americans’ top priority. This beat out other top concerns like “defending against terrorism”, “reducing influence of money in politics”, and “reducing health care costs”.
What does the 2024 US Election mean for markets?
There is a perception among many investors that if one party wins the Presidency, that will drive market action in one way or the other. Indeed, there is significant media and research pointing to positioning and timing surrounding a pivotal election.
Our investment team looked back over the past eight election cycles at the S&P 500 returns. They observed that historically, there are very few patterns for the broader markets performing in a particular way.
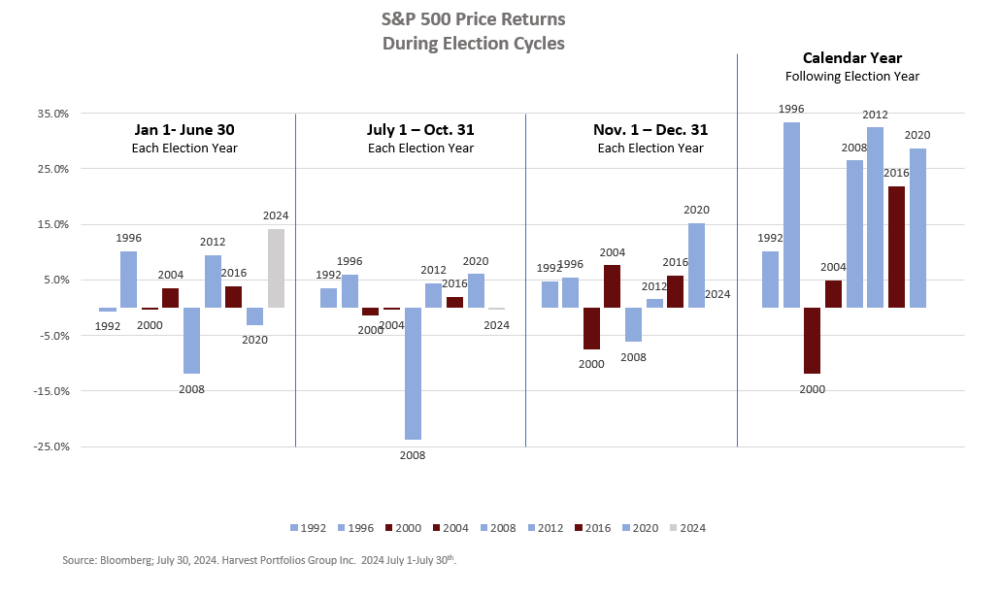
They found that no matter which party was elected to the Presidential Office, the returns for the broader market varied in each of the periods leading up to the past eight elections. This is shown in chart below illustrating the S&P 500 price returns from first-half, back-half, and final 60 days of an election year, and the returns for the calendar year following the election. Moreover, it is evident that markets have delivered strong returns on average immediately following election years. The team believes this has more to do with the longer measured period and less to do with the election itself.
The historical data on the S&P 500 price returns spans from 1992 – when Democrat Bill Clinton declared the victor – to 2020 – when Democrat Joe Biden prevented the incumbent Donald Trump from securing a second consecutive term. It shows that the markets consistently performed well in the calendar year following an election year. The lone exception over the past three decades is 2000, when the September 11, 2001 attacks, and subsequent fallout, significantly disrupt domestic and international markets.

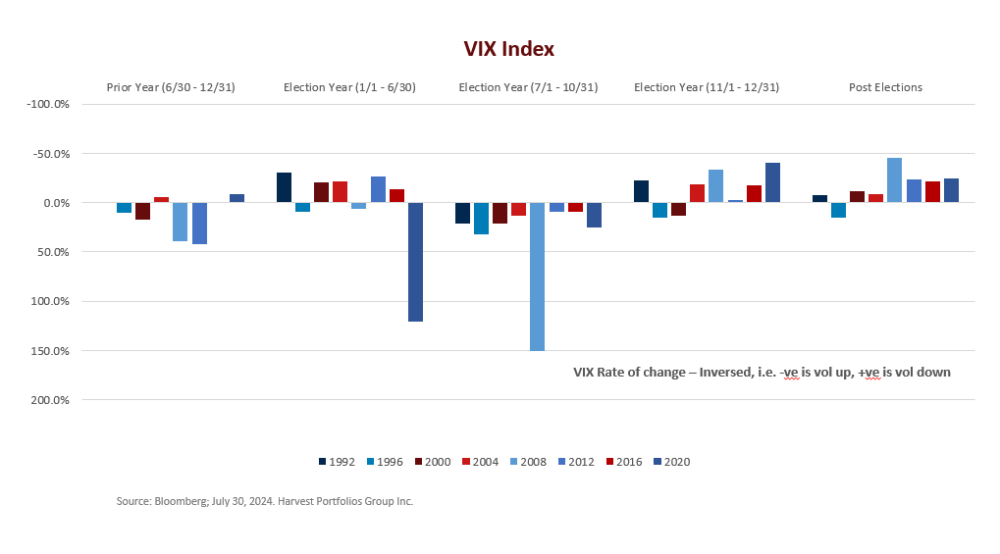
Our team has also looked at measures of volatility. The Chicago Board Options Exchange’s CBOE Volatility Index – typically referred by its short-hand ‘VIX’ – is a popular measure of the broader stock market’s expectation of volatility. This is based on S&P 500 index options.
It is worth noting that our team expects volatility – both to upside and downside – to increase as the US Presidential Election nears. However, the team also expects volatility to subside in the months following the election. That represents a potential advantage for Harvest’s covered call Income ETFs as cash flows can be generated from those call options. After all, the ability to monetize volatility has contributed to the strong performance for several to Harvest ETFs.
The chart below illustrates the performance of the VIX Index in every election cycle from 1992 through to 2020. As expected, 2008 and 2020 showed major volatility due to the financial crisis and the impacts of the COVID-19 pandemic, respectively.

Why diversification is important
Along with diversification within an asset class, some investors may have preference for balance in asset mix and may have a need for frequent income.
To help satisfy this need, Harvest ETFs launched the Harvest Balanced Income & Growth ETF (HBIG:TSX) earlier this year. This ETF is built to deliver high monthly cash distributions and provide the opportunity for capital appreciation. HBIG invests in a portfolio of ETFs that are listed on a recognized North American stock exchange that provide exposure towards large-cap equity securities and investment grade bonds or money market instruments issued by corporations or governments.
HBIG is a simple way to invest in a 60/40 equity/fixed income portfolio. It last paid out a monthly cash distribution of $0.1600 per unit. Calculated on an annualized basis using the last closing NAV price of $24.94, that represents a 7.72% yield. Ultimately, HBIG provides diversification by providing exposure to top Harvest Equity Income ETFs and Fixed Income ETFs.
Disclaimer
The content of this article is to inform and educate and therefore should not be taken as investment, tax, or financial advice. Commissions, management fees and expenses all may be associated with investing in Harvest Exchange Traded Funds (managed by Harvest Portfolios Group Inc.). Please read the relevant prospectus before investing. The funds are not guaranteed, their values change frequently, and past performance may not be repeated. Certain statements included in this communication constitute forward-looking statements (“FLS”), including, but not limited to, those identified by the expressions “expect”, “intend”, “will” and similar expressions to the extent they relate to the Fund. The FLS are not historical facts but reflect Harvest’s, the Manager of the Fund, current expectations regarding future results or events. These FLS statements are subject to a number of risks and uncertainties that could cause actual results or events to differ materially from current expectations. Although Harvest, the Manager of the Fund, believes that the assumptions inherent in the FLS are reasonable, FLS are not guarantees of future performance and, accordingly, readers are cautioned not to place undue reliance on such statements due to the inherent uncertainty therein. Harvest, the Manager of the Fund, undertakes no obligation to update publicly or otherwise revise any FLS or information whether as a result of new information, future events or other such factors which affect this information, except as required by law.


