By Avinash D’Souza
As of early 2026, investor perception of the technology sector has transitioned from a phase of “irrational exuberance” to one of “industrial utility.” If 2024–2025 was about the race to build the engine (chips and LLMs), 2026 is about the race to drive it. Investing in tech today is no longer a bet on future breakthroughs, but a play on the monetization of AI infrastructure and the resiliency of cash-rich incumbents.
To ground the technology investment thesis for early 2026, we are at the infrastructure buildout phase of an AI-driven productivity cycle; a parallel is the late 1990s telecom/internet buildout, but with one critical difference: enterprise monetization is already occurring, not merely anticipated.
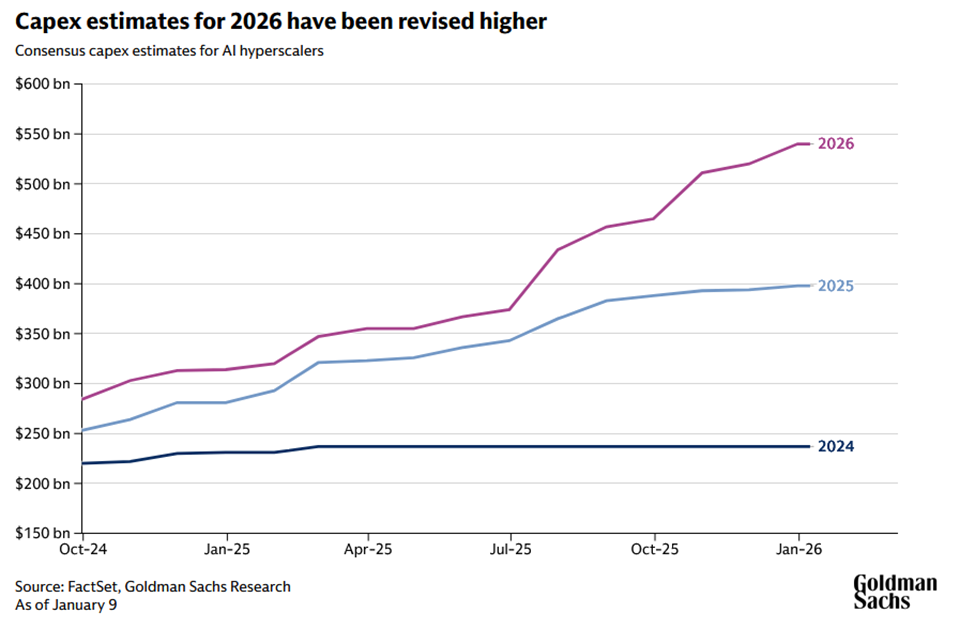
AI Capital Expenditure Supercycle
Hyper-scalers such as Microsoft, Google, Amazon, Meta are committing hundreds of billions in annual capex to data centers, GPUs, and model infrastructure. This spending has multi-year velocity regardless of near-term macro conditions, creating durable revenue visibility for semiconductor, power infrastructure, and cloud platform companies. Further, AI spending broadens beyond mega-caps into edge compute, cybersecurity, and data centers, with global IT projected to exceed $6 trillion in 2026.
Enterprise Software Replatforming
The market has shifted from “Chat” to “Action.” Enterprise software is being repriced as AI enhances human productivity while compressing labor costs. Companies embedding AI agents into workflows (CRM, ERP, DevOps) are seeing net revenue retention expand, a leading indicator that multiples may be sustainably higher than pre-AI norms. Agentic AI is driving the first measurable wave of enterprise productivity gains and, according to Gartner, it is projected to drive approximately 30% of enterprise software revenue by 2035, reaching an estimated $450 billion. It’s key to look past the model providers and toward the application layer that shows early promise of monetization of AI features at enterprise scale.
Tech Ballast
With interest rates holding at higher-than-pre-pandemic levels, “growth at any cost” is dead. However, the Big Tech titans (Nvidia, Microsoft, Alphabet, etc.) sit on record cash piles and generate massive free cash flow. With J.P. Morgan forecasting a 35% probability of a U.S. and global recession in 2026, these companies act as a “safe haven” because of the strength of their balance sheets and dominance in their respective markets.
Enter HTA…
The Harvest Tech Achievers Growth & Income ETF (TSX: HTA) is designed for Canadian investors looking for exposure to global large-cap tech companies, while also earning monthly income. With over a ten-year track record, a careful stock screening strategy, and one of the most extended records of monthly distributions among Canadian covered call ETFs, HTA presents an opportunity for investors looking to integrate mix growth and income in their portfolios.
1 | Fund Overview
HTA launched in May 2015, making it one of the longest-running technology covered call ETFs in Canada. With CAD $725M in AUM and a management fee of 0.85%, the fund is available in three share classes to meet investors’ needs:
- HTA — CAD Hedged
- HTA.B — CAD Unhedged
- HTA.U — USD-denominated
HTA offers exposure to top names in the technology sector and consistent monthly cash flow.
| Full Name | Harvest Tech Achievers Growth & Income ETF |
| Ticker* | HTA / HTA.B / HTA.U (TSX) |
| Inception Date | May 26, 2015* |
| AUM | CAD $725M as of February 24, 2026 |
| Management Fee | 0.85% |
| Management Style | Active with Covered Calls |
| Currency Options | CAD Hedged (HTA) / Unhedged (HTA.B) / USD (HTA.U) |
| Uses Leverage | No |
| Distribution Frequency | Monthly |
| Last Paid Distribution | $0.16/unit |
| Risk Rating | Medium-High |
2 | Portfolio Construction: Quality Over Quantity
Portfolio construction is where the HTA story starts becoming compelling for investors and advisors.
HTA holds 20 actively selected, equal-weighted large-cap technology leaders, each capped at approximately 5% of the portfolio. This equal-weighting philosophy is deliberate: by sizing each position equally, HTA ensures that conviction in a name like Broadcom or Palo Alto Networks carries the same portfolio weight as Apple or Microsoft. No single stock dominates, and sector concentration is managed with discipline.
Further, HTA is designed to capture growth across several distinct tech verticals including Artificial Intelligence (AI), Cybersecurity, Big Data, and Cloud Computing. As of the end of January 2026, the portfolio breaks down into the following key sub-sectors:
Sub-Sector Allocation
Source: Harvest ETFs, As at February 27, 2026
The Harvest Quality Screen
Security selection is driven by a “quantamental” screen, that’s a combined quantitative and fundamental analysis screen. It filters the global large-cap technology universe on three dimensions:
- Average current year Forward P/E Ratio below average for Technology Achievers Investable Universe;
- Average 3-year RoE above average for Technology Achievers Investable Universe; and
- Average PEG Ratio below average for the Technology Achievers Investable Universe.
This combination of valuation discipline, profitability screening, and growth sensitivity is designed to identify tech leaders with durable earnings power potential; not just the largest or most popular names. Current holdings include NVDA, AAPL, MSFT, META, GOOGL, AVGO, ORCL, NOW, and CSCO, each at approximately 5% of the portfolio.
Portfolio Snapshot
| Number of Holdings | 20 stocks |
| Weighting Method | Equal Weight (~5% each) |
| Universe | Actively selected global large-cap tech leaders |
| Top Holdings | NVDA, AAPL, MSFT, META, GOOGL, AVGO, ORCL, PANW, NOW, MSI (equal ~5%) |
| Sector Coverage | Technology: semiconductors, software, hardware, communications |
| Avg. Market Cap per Holding | ~CAD $1.5 Trillion |
| Portfolio Management Style | Active (Harvest selects & rebalances holdings) |
| Avg. 5-Year Return on Equity | 30.17% |
3 | Covered Call Strategy: Income with Upside Preserved
The covered call strategy is the engine that seeks to convert technology equity volatility into monthly income. It is designed to optimise the balance between distribution yield generation and long-term capital appreciation for HTA.
Within HTA, the call option level is capped at 33% of each position and is written using flexible strike prices that can be adjusted out-of-the-money (OTM) or at-the-money (ATM) based on short-term market momentum. The 33% cap is a deliberate design choice.
The philosophy is straightforward: It allows HTA to harness a relatively high NAV ( net asset value ) appreciation potential while maximising option premium income in any given month. In strong technology years, like 2021 or 2023 this philosophy pays off handsomely, as HTA participates meaningfully in the rally (2021 +42.8%) (2003 +52.8%), rather than having its upside capped by excessive option coverage.
Covered Call Parameters
| Max Coverage | Up to 33% of portfolio holdings |
| Strike Price Approach | Flexible (OTM or ATM; adjusts based on market momentum) |
| Upside Participation | High (33% coverage ratio, flexible OTM strikes) |
| Income Generation | High (selective use of calls) |
This approach reflects Harvest’s conviction that a covered call overlay should complement the equity portfolio, not dominate it. The result is a fund that earns meaningful option premium while still allowing investors to benefit from the long-term growth trajectory of the technology sector.
4 | Yield & Distributions: A Decade of Consistent Monthly Income
HTA currently yields 10.33% annualised, using a monthly distribution of $0.16 per unit as of January 31, 2026—an increase from $0.14 per unit, which is a 14%+ increase in the monthly payout. This increase reflects Harvest’s confidence in the income-generating capacity of both the underlying portfolio and the options program.
Since inception in May 2015, HTA has paid over CAD $10.58 in cumulative distributions per unit; one of the longest and most consistent monthly income track records in the Canadian covered call ETF space. That consistency spans multiple market cycles, including the COVID-19 selloff of 2020, the interest rate shock of 2022, and the AI-driven bull market of 2023–2024.
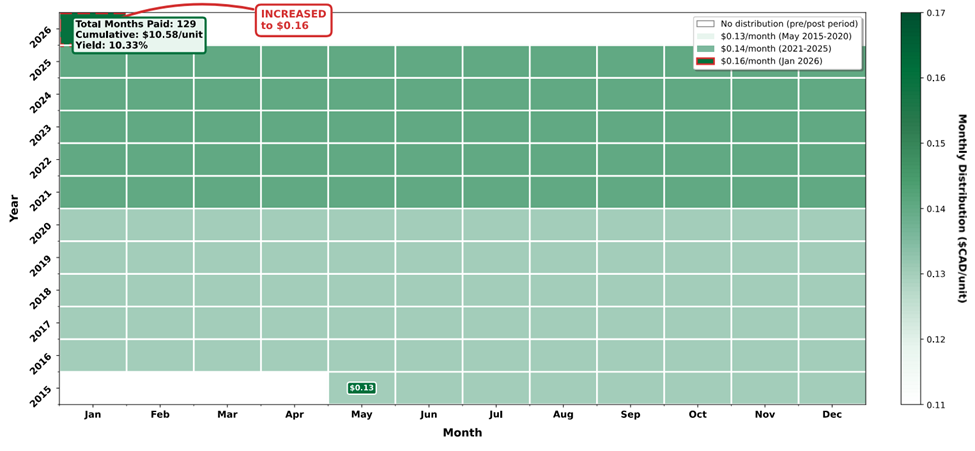
HTA is the one of the few ETFs in its category with consistent monthly distributions that have been increased three times since existence (the most recent was to $0.16 in January 2026), demonstrating stable and growing distribution potential alongside a proven 10+ year payment track record. For income-oriented investors, the combination of distribution yield level, payment history and distribution growth potential, is a standout feature in the Canadian ETF landscape.
Distribution Summary
| Current Annualised Yield | 10.33% |
| Last Monthly Distribution (HTA) | CAD $0.1600/unit (January 2026) |
| Distribution Frequency | Monthly |
| Cumulative Distributions Since Inception | Over CAD $10.58/unit |
| Distribution History | Consistent since 2015; recently increased to $0.16 in Jan 2026 |
| DRIP Available | Yes |
5 | Performance: A Long-Term Track Record That Matters
Performance data is where HTA’s long-term value proposition comes into sharp focus.
HTA’s 10-year annualised total return of 18.31% is a standout result in the Canadian ETF universe. The chart below illustrates that a $10,000 investment in HTA at inception in May 2015 would have grown to over $46,000 by January 2026 on a total return basis; this highlights the power of compounding from active portfolio management combined with a covered call overlay that has produced meaningful NAV growth.
Illustrative $10,000 Growth Chart
Cumulative Growth $10,000 Invested (Nav Pricing)
Source: Harvest ETFs, As at February 27, 2026
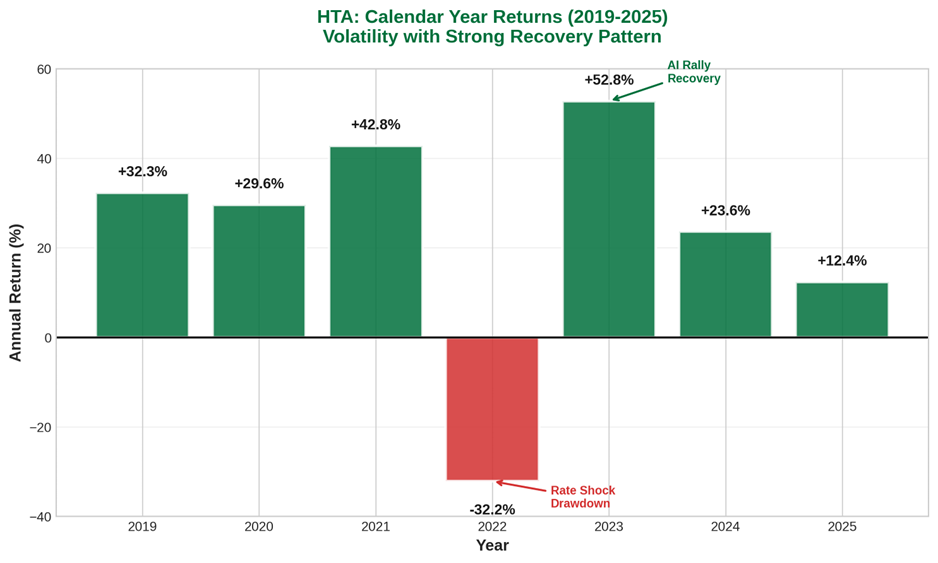
This performance is not limited to bull markets. HTA has delivered meaningful returns across multiple distinct market regimes, from the COVID recovery (2020: +29.59%) to the post-pandemic tech surge (2021: +42.80%) and the AI-driven rally (2023: +52.79%).
Annual Performance
As at February 28, 2026
| Ticker | 1M | 3M | 6M | YTD | 1Y | 2Y | 3Y | 4Y | 5Y | 7Y | 8Y | 10Y | SI |
|---|---|---|---|---|---|---|---|---|---|---|---|---|---|
| HTA | (5.13) | (2.83) | 0.92 | (4.76) | 9.50 | 9.60 | 22.71 | 12.11 | 13.64 | 17.16 | 15.40 | 17.66 | 14.73 |
| HTA.B | (4.82) | (4.59) | 1.28 | (5.03) | 5.42 | 11.64 | 24.29 | 15.72 | 16.53 | - | - | - | 19.56 |
| HTA.U | (4.98) | (2.27) | 1.97 | (4.44) | 11.82 | 11.36 | 24.31 | 13.62 | 14.92 | 18.66 | 16.81 | - | 17.78 |
Calendar Year Returns
| Year | Performance |
| 2025 | +12.38% |
| 2024 | +23.62% |
| 2023 | +52.79% |
| 2022 (Bear Market) | -32.17% |
| 2021 | +42.80% |
| 2020 | +29.59% |
| 2019 | +32.28% |
Summary
HTA is built for a specific investor: one who wants meaningful technology sector exposure, active quality screening to filter out speculative names, core and consistent monthly income that currently offers 10%+ annualised distribution yield, and a fund with a decade of live performance history navigating multiple market cycles.
The fund’s 33% covered call ceiling is a conscious choice that optimises long-term total return with short-term income maximisation. Across the fund’s history, this philosophy has delivered a 10-year annualised return of 18.31% and over CAD $10.58 in cumulative distributions per unit—a combination that very few products in the Canadian ETF universe can match.
For investors in accumulation who want monthly cash flow without sacrificing long-term growth potential, or for retirees who want tech exposure with income they can count on, HTA presents a well-constructed, battle-tested solution.
Disclaimer
The information is meant to provide general information for educational purposes. Commissions, management fees and expenses all may be associated with investing in Harvest Exchange Traded Funds managed by Harvest Portfolios Group Inc. (“Funds”). Please read the relevant prospectus before investing. The indicated rates of return are the historical annual compounded total returns (except for figures of one year or less, which are simple total returns) including changes in unit value and reinvestment of all distributions and do not take into account sales, redemption, distribution or optional charges or income taxes payable by any securityholder that would have reduced returns. The Funds are not guaranteed, their values change frequently and past performance may not be repeated. Distributions are paid to you in cash unless you request, pursuant to your participation in a distribution reinvestment plan, that they be reinvested into Class A, Class B or Class U units of the Fund. If the Fund earns less than the amounts distributed, the difference is a return of capital. Tax, investment and all other decisions should be made with guidance from a qualified professional.
The current yield represents an annualized amount that is comprised of 12 unchanged monthly distributions (using the most recent month’s distribution figure multiplied by 12) as a percentage of the closing market price of the Fund. The current yield does not represent historical returns of the ETF.
*Inception Date: Class A is 2015/05/26; Class B is 2020/03/12; Class U is 2017/06/22.
Certain statements included in this communication constitute forward-looking statements (“FLS”), including, but not limited to, those identified by the expressions “expect”, “intend”, “will” and similar expressions to the extent they relate to the Fund. The FLS are not historical facts but reflect Harvest’s, the Manager of the Fund, current expectations regarding future results or events. These FLS statements are subject to a number of risks and uncertainties that could cause actual results or events to differ materially from current expectations. Although Harvest, the Manager of the Fund, believes that the assumptions inherent in the FLS are reasonable, FLS are not guarantees of future performance and, accordingly, readers are cautioned not to place undue reliance on such statements due to the inherent uncertainty therein. Harvest, the Manager of the Fund, undertakes no obligation to update publicly or otherwise revise any FLS or information whether as a result of new information, future events or other such factors which affect this information, except as required by law.