By Ambrose O’Callaghan
In his 2024 re-election campaign, US President Donald Trump vowed to pursue an aggressive trade policy that aimed to reduce or altogether eliminate what he viewed as unacceptable deficits between adversaries and allies alike. Following his January inauguration, President Trump has put Canada and Mexico into his crosshairs. Tariffs continue to be one of his favourite tools, if his rhetoric is any indication.
A tariff is a tax that is imposed by a country on the goods imported from another country. It is typically collected by a country’s customs authority. Some economists have argued that this results in a larger burden being paid by consumers, as companies will pass on tariff costs to the consumer.
In this piece, we will look at how ongoing trade tensions could impact world economies and markets. After that, we will zero-in on ETFs that can potentially provide protection against the current bout of volatility.
Trade policy volatility and Canada
Last month, we’d look at the impact the new GOP administration could have on the industrials space. That piece explored the trade policy volatility that existed in the first Trump administration.
Baker, Bloom & Davis
US Categorical Economic Policy Uncertainty Index – Trade Policy
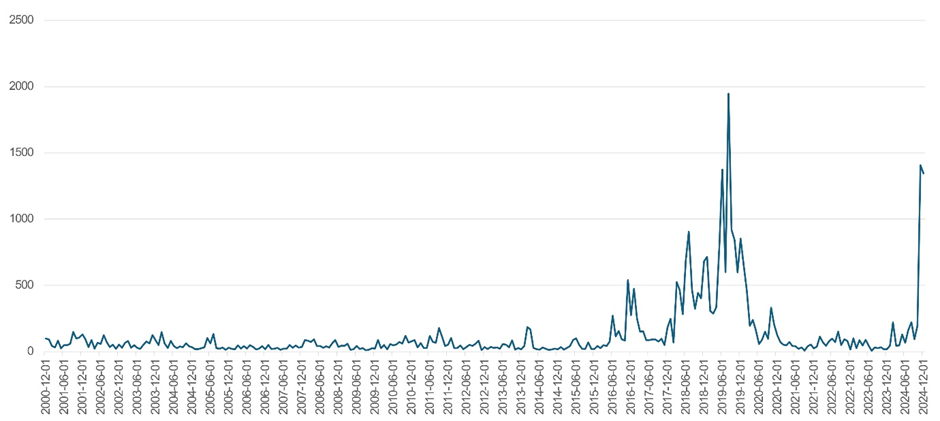
Source: Baker, Bloom & Davis. Bloomberg, Harvest ETFs, as of January 21, 2025.
On Monday, February 3, 2025, US and global markets suffered sharp pullbacks in the morning hours. However, markets recovered after the Trump administration announced that tariffs on Mexico and Canada would be delayed for 30 days.
Canada finds itself at a crossroads as it contends with unprecedented pressure from a long-time ally, political uncertainty on the domestic front, and muted and decelerating economic data. The Bank of Canada must weight these pressures as it determines how much it can slash interest rates to bolster economic activity.
That aside, Canada is home to many great companies with oligopolistic qualities. We detailed their strengths in a piece in October 2024. The Harvest Canadian Equity Leaders Income ETF (HLIF:TSX) invests in 30 of Canada’s most powerful and largest companies for their traits and growth potential. It overlays an active covered call strategy, which seeks to generate high monthly cash distributions.
Combat trade volatility with defence and diversification
Defensive sectors contain businesses that are stable, possess key barriers to entry, and are relatively immune to economic fluctuations.
Healthcare falls in this defensive category and is unique in its diversity. It includes companies that manufacture medical devices and equipment, as well as those that are involved in the making of diagnostic tools and lab equipment, companies involved in the ownership of doctors’ networks, as well as facilities and companies in the Managed Care segment.
The Harvest Healthcare Leaders Income ETF (HHL:TSX) is an equally weighted portfolio of 20 large-cap global healthcare companies. HHL aims to generate an attractive monthly distribution through an active covered call writing strategy. This ETF has paid out over $500 million in total monthly distributions to unit holders since its inception.
Annualized Performance
As at May 31, 2026
| Ticker | 1M | 3M | 6M | YTD | 1Y | 2Y | 3Y | 4Y | 5Y | 7Y | 8Y | 10Y | 11Y | SI |
|---|---|---|---|---|---|---|---|---|---|---|---|---|---|---|
| HHL | (0.21) | (8.42) | (8.10) | (7.16) | 5.98 | 0.35 | 4.80 | 3.90 | 5.52 | 8.51 | 7.26 | 6.62 | 5.74 | 6.08 |
| HHL.B | 1.39 | (7.02) | (8.55) | (6.12) | 8.35 | 2.51 | 6.71 | 7.37 | 9.33 | - | - | - | - | 8.91 |
| HHL.U | (0.10) | (8.01) | (7.32) | (6.53) | 7.85 | 1.92 | 6.16 | 5.08 | 6.46 | 9.58 | 8.31 | - | - | 8.35 |
Utilities is a space that is often targeted by investors who are looking to shore up a defensive position in their portfolios. Companies in the utilities space possess enormous scale, significant barriers to entry, and dominance in their respective markets. The Harvest Equal Weight Global Utilities ETF (HUTL:TSX) offers access to a globally diversified portfolio of utilities equities. That global diversification offers benefits like reducing interest rate and natural disaster risk with exposure to different countries and regions.
HUTL also overlays an active covered call writing strategy. It aims to generate high monthly cash distributions while reducing volatility.
Annualized Performance
As at May 31, 2026
| Ticker | 1M | 3M | 6M | YTD | 1Y | 2Y | 3Y | 4Y | 5Y | 6Y | 7Y | SI |
|---|---|---|---|---|---|---|---|---|---|---|---|---|
| HUTL | (0.59) | (1.85) | 9.81 | 10.29 | 16.22 | 17.26 | 13.87 | 7.89 | 8.72 | 9.45 | 7.14 | 7.56 |
Meanwhile, the Harvest Diversified Monthly Income ETF (HDIF:TSX) is designed to deliver consistent monthly income and diverse growth opportunities by holding a portfolio of Harvest Equity Income ETFs. This multi-sector portfolio captures a large and diverse set of high-quality companies.
The underlying Equity Income ETFs in HDIF are overlaid with an active covered call writing strategy to generate monthly cash distributions. This ETF employs modest leverage at approximately 25% to deliver even higher levels of monthly cash distributions and growth potential.
Annualized Performance
As at May 31, 2026
| Symbol | 1M | 3M | 6M | YTD | 1Y | 2Y | 3Y | 4Y | SI |
|---|---|---|---|---|---|---|---|---|---|
| HDIF | 6.05 | 10.19 | 12.53 | 11.36 | 29.64 | 19.92 | 19.21 | 11.85 | 9.59 |
Conclusion
Trade policy volatility is likely here to stay in the near term. Instead of focusing on geopolitical risks, readers should remain committed to the same principles and fundamentals that underpin sound long-term investing. Harvest ETFs invest in leading businesses, long-term growth industries, or growth trends. The covered call option strategy seeks to provide consistent monthly cash distributions, while monetizing market volatility.
Disclaimer:
Commissions, management fees and expenses all may be associated with investing in Harvest ETFs managed by Harvest Portfolios Group Inc. (the “Funds” or a “Fund”). Please read the relevant prospectus before investing. The Funds’ returns are not guaranteed, their values change frequently, and past performance may not be repeated. Tax investment and all other decisions should be made with guidance from a qualified professional. The indicated rates of return are the historical annual compounded total returns (except for figures of one year or less, which are simple total returns) including changes in unit value and reinvestment of all distributions and do not take into account sales, redemption, distribution or optional charges or income taxes payable by any securityholder that would have reduced returns. The current yield is the annualized monthly distribution over the next 12 months as a percentage of the closing market price of the Fund. If the Fund earns less than the amounts distributed, the difference is a return of capital.