Key Facts
As at 2025/10/24
TICKER
HDIF
TSX
CURRENCY
CAD-Hedged
Underlying ETFs
NAV
$8.94
Updated Daily
MKT PRICE CLOSE
$8.92
Updated Daily
NET AUM*
$459.95M
Updated Daily
MGMT STYLE
Active
With Covered Calls
Underlying ETFs
CURRENT YIELD
9.97%
Updated Daily
LAST DISTRIBUTIONS
$0.0741
Cash, Per unit
CASH DISTRIBUTIONS
Monthly
Frequency
HOLDINGS
10
Underlying ETFs
Distributions
|
Last Ex-dividend Date: 2025/09/29 |
|
Last Record Date: 2025/09/29 |
|
Last Payment Date: 2025/10/09 |
|
Last Cash Distribution Per Unit: $0.0741 |
|
Cash Distribution Frequency: Monthly |
|
Cash Distributions Since Inception: $3.0939 |
| Ex-dividend Date | Record Date | Payment Date | Class A | Distribution Frequency |
|---|---|---|---|---|
| 2025/09/29 | 2025/09/29 | 2025/10/09 | $0.0741 | Monthly |
| 2025/08/29 | 2025/08/29 | 2025/09/09 | $0.0741 | Monthly |
| 2025/07/31 | 2025/07/31 | 2025/08/08 | $0.0741 | Monthly |
| 2025/06/30 | 2025/06/30 | 2025/07/09 | $0.0741 | Monthly |
| 2025/05/30 | 2025/05/30 | 2025/06/09 | $0.0741 | Monthly |
| 2025/04/30 | 2025/04/30 | 2025/05/09 | $0.0741 | Monthly |
| 2025/03/31 | 2025/03/31 | 2025/04/09 | $0.0741 | Monthly |
| 2025/02/28 | 2025/02/28 | 2025/03/07 | $0.0741 | Monthly |
| 2025/01/31 | 2025/01/31 | 2025/02/07 | $0.0741 | Monthly |
| Ex-dividend Date | Record Date | Payment Date | Class A | Distribution Frequency |
|---|---|---|---|---|
| 2024/12/31 | 2024/12/31 | 2025/01/09 | $0.0741 | Monthly |
| 2024/11/29 | 2024/11/29 | 2024/12/09 | $0.0741 | Monthly |
| 2024/10/31 | 2024/10/31 | 2024/11/08 | $0.0741 | Monthly |
| 2024/09/27 | 2024/09/27 | 2024/10/09 | $0.0741 | Monthly |
| 2024/08/30 | 2024/08/30 | 2024/09/09 | $0.0741 | Monthly |
| 2024/07/31 | 2024/07/31 | 2024/08/09 | $0.0741 | Monthly |
| 2024/06/28 | 2024/06/28 | 2024/07/09 | $0.0708 | Monthly |
| 2024/05/31 | 2024/05/31 | 2024/06/07 | $0.0708 | Monthly |
| 2024/04/29 | 2024/04/30 | 2024/05/09 | $0.0708 | Monthly |
| 2024/03/27 | 2024/03/28 | 2024/04/09 | $0.0708 | Monthly |
| 2024/02/28 | 2024/02/29 | 2024/03/08 | $0.0708 | Monthly |
| 2024/01/30 | 2024/01/31 | 2024/02/09 | $0.0708 | Monthly |
| Ex-dividend Date | Record Date | Payment Date | Class A | Distribution Frequency |
|---|---|---|---|---|
| 2023/12/28 | 2023/12/29 | 2024/01/09 | $0.0708 | Monthly |
| 2023/11/29 | 2023/11/30 | 2023/12/08 | $0.0708 | Monthly |
| 2023/10/30 | 2023/10/31 | 2023/11/09 | $0.0708 | Monthly |
| 2023/09/28 | 2023/09/29 | 2023/10/06 | $0.0708 | Monthly |
| 2023/08/30 | 2023/08/31 | 2023/09/08 | $0.0708 | Monthly |
| 2023/07/28 | 2023/07/31 | 2023/08/09 | $0.0708 | Monthly |
| 2023/06/29 | 2023/06/30 | 2023/07/07 | $0.0708 | Monthly |
| 2023/05/30 | 2023/05/31 | 2023/06/09 | $0.0708 | Monthly |
| 2023/04/27 | 2023/04/28 | 2023/05/09 | $0.0708 | Monthly |
| 2023/03/30 | 2023/03/31 | 2023/04/06 | $0.0708 | Monthly |
| 2023/02/27 | 2023/02/28 | 2023/03/09 | $0.0708 | Monthly |
| 2023/01/30 | 2023/01/31 | 2023/02/09 | $0.0708 | Monthly |
| Ex-dividend Date | Record Date | Payment Date | Class A | Distribution Frequency |
|---|---|---|---|---|
| 2022/12/29 | 2022/12/30 | 2023/01/09 | $0.0708 | Monthly |
| 2022/11/29 | 2022/11/30 | 2022/12/09 | $0.0708 | Monthly |
| 2022/10/28 | 2022/10/31 | 2022/11/09 | $0.0708 | Monthly |
| 2022/09/28 | 2022/09/29 | 2022/10/07 | $0.0708 | Monthly |
| 2022/08/30 | 2022/08/31 | 2022/09/09 | $0.0708 | Monthly |
| 2022/07/28 | 2022/07/29 | 2022/08/09 | $0.0708 | Monthly |
| 2022/06/29 | 2022/06/30 | 2022/07/08 | $0.0708 | Monthly |
| 2022/05/30 | 2022/05/31 | 2022/06/09 | $0.0708 | Monthly |
| 2022/04/28 | 2022/04/29 | 2022/05/09 | $0.0708 | Monthly |
| 2022/03/30 | 2022/03/31 | 2022/04/08 | $0.0708 | Monthly |
Sub-Sector Allocation
Underlying ETFs - As at September 30, 2025
Holdings
As at September 30, 2025
Annualized Performance
| Symbol | 1M | 3M | 6M | YTD | 1Y | 2Y | 3Y | SI | |
|---|---|---|---|---|---|---|---|---|---|
| HDIF | 1.43 | 6.19 | 12.29 | 10.03 | 11.35 | 20.99 | 17.08 | 6.76 |
Calendar Year Performance †
| Ticker | 2024 | 2023 | 2022 | |||||||
|---|---|---|---|---|---|---|---|---|---|---|
| HDIF | 18.98 | 12.45 | (13.86) |
Cumulative Market Price#
Cumulative Growth $10,000 Invested
(NAV pricing)
The “Growth of $10,000 invested” chart shows the final value of a hypothetical $10,000 investment in securities in this class/series of the fund as at the end of the investment period indicated and is not intended to reflect future values or returns on investment in such securities.
HDIF Historical Daily Prices (CLICK HERE)
Documents
| Document | Language | Type | |
|---|---|---|---|
| Product Sheet | English | French | Fund Documents |
| ETF Facts | English | French | Regulatory |
| Prospectus | English | French | Regulatory |
| ETF Products Booklet | English | French | Information Materials |
| Covered Call Writing | English | French | Information Materials |
| MER Summary | English | French | Information Materials |
| 2025 Quarterly Summary - Q1 | English | - | Portfolio Disclosure |
| 2024 Quarterly Summary - Q3 | English | - | Portfolio Disclosure |
| 2025 Interim Financial Statements | English | French | Statements/MRFPs |
| 2025 Interim Management Report of Fund Performance | English | French | Statements/MRFPs |
| 2024 Annual Financial Statements | English | French | Statements/MRFPs |
| 2024 Annual Management Report of Fund Performance | English | French | Statements/MRFPs |
| 2024 Annual Distributions Summary | English | - | Information Materials |
| PFIC Annual Information Statement | English | - | Information Statement |
| IRS Form 8937 | English | - | Tax Form |
| Proxy Voting Policy | English | - | Proxy Voting |
| Proxy Voting Records | English | - | Proxy Voting |
HDIF Historical Documents (CLICK HERE)
Investment Goal
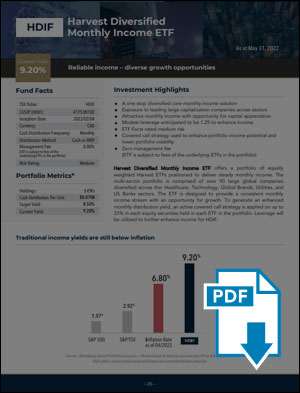
Harvest Diversified Monthly Income ETF offers a portfolio of Harvest ETFs positioned to deliver steady monthly income. The multi-sector portfolio is comprised of large global companies diversified across key sectors: Healthcare, Technology, and Utilities among others. The ETF is designed to provide a consistent monthly income stream with an opportunity for growth. The portfolio is reconstituted and rebalanced at a minimum quarterly. To generate an enhanced monthly distribution yield, an active covered call strategy is applied on up to 33% of each equity securities held in underlying portfolios.
Benefits of investing in HDIF
|
 |
Key ETF Details
As at September 30, 2025
| ETF Details | Unit |
|---|---|
| TSX Code | HDIF |
| CUSIP | 41753N102 |
| Currency | CAD-Hedged (underlying class A ETFs) |
| Inception Date | 2022/02/04 |
| Holdings | 10 ETFs |
| Management Style | Active with Covered Calls (underlying ETFs) |
| Eligible | RRSP | RRIF | RESP | TFSA | FHSA |
| Management Fee | Zero Management Fee (ETF is subject to fees of the underlying ETFs in the portfolio) |
| Risk Rating | |
| Distribution Facts | Unit |
| Last Cash Distribution Per Unit | CA$0.0741 |
| Last Record Date | 2025/09/29 |
| Cash Distributions Since Inception | CA$3.0939 |
| Distribution Frequency | Monthly |
| Distribution Method | Cash or DRIP |
| Annual Distributions Summary | PDF View |
Relevant Insights
Disclaimer
Harvest Diversified Monthly Income ETF
Commissions, management fees and expenses all may be associated with investing in Harvest Exchange Traded Funds (managed by Harvest Portfolios Group Inc.). Please read the relevant prospectus before investing. The indicated rates of return are the historical annual compounded total returns (except for figures of one year or less, which are simple total returns) including changes in unit value and reinvestment of all distributions and do not take into account sales, redemption, distribution or optional charges or income taxes payable by any securityholder that would have reduced returns. The funds are not guaranteed, their values change frequently and past performance may not be repeated. Tax investment and all other decisions should be made with guidance from a qualified professional.
The current yield represents an annualized amount that is comprised of 12 unchanged monthly distributions (using the most recent month’s distribution figure multiplied by 12) as a percentage of the closing market price of the Fund. The current yield does not represent historical returns of the ETF but represents the distribution an investor would receive if the most most recent distribution stayed the same going forward.
* Represents aggregate AUM of all classes denominated in Canadian dollars.
† The first year of Calendar Year Performance presents the rate of return from commencement of operations to December 31 of that year.
‡ Source: Bloomberg. Average statistics calculated based on portfolio weighted average. Dividend yield (gross) based on Bloomberg indicated 12 month yield of portfolios positions and does not represent the distribution yield paid to investors. The above information is for illustrative purposes only, is estimated and unaudited.
# For illustrative purposes only. The chart above only shows the market value per unit of Harvest Diversified Monthly Income ETF ("HDIF") using the daily market close on the TSX and identifies the monthly cash distributions paid by HDIF on a cumulative basis. The cash distributions are not compounded or treated as reinvested, and the chart does not take into account sales, redemption, distribution or optional charges or income taxes payable by any unitholder. The chart is not a performance chart and is not indicative of future market values of HDIF or returns on investment in HDIF, which will vary.


